SAS “Statistical Analysis System” is a statistical software suite developed by SAS Institute for data management, data analysis, predictive analytics, business intelligence, and much more.
By nature any tool you use for these purposes should be fast enough to process the huge data and all the features within the tool must be well designed and interactive.
That’s where SAS comes into the picture. SAS has a rich user interface. User experience is something SAS takes very seriously and that’s the main thing people in analytics love about SAS.
SAS user interface is so rich compared to other options available at this point such as R, Python, etc. (Learn more SAS vs R vs Python)
SAS User Interface: Products/tools
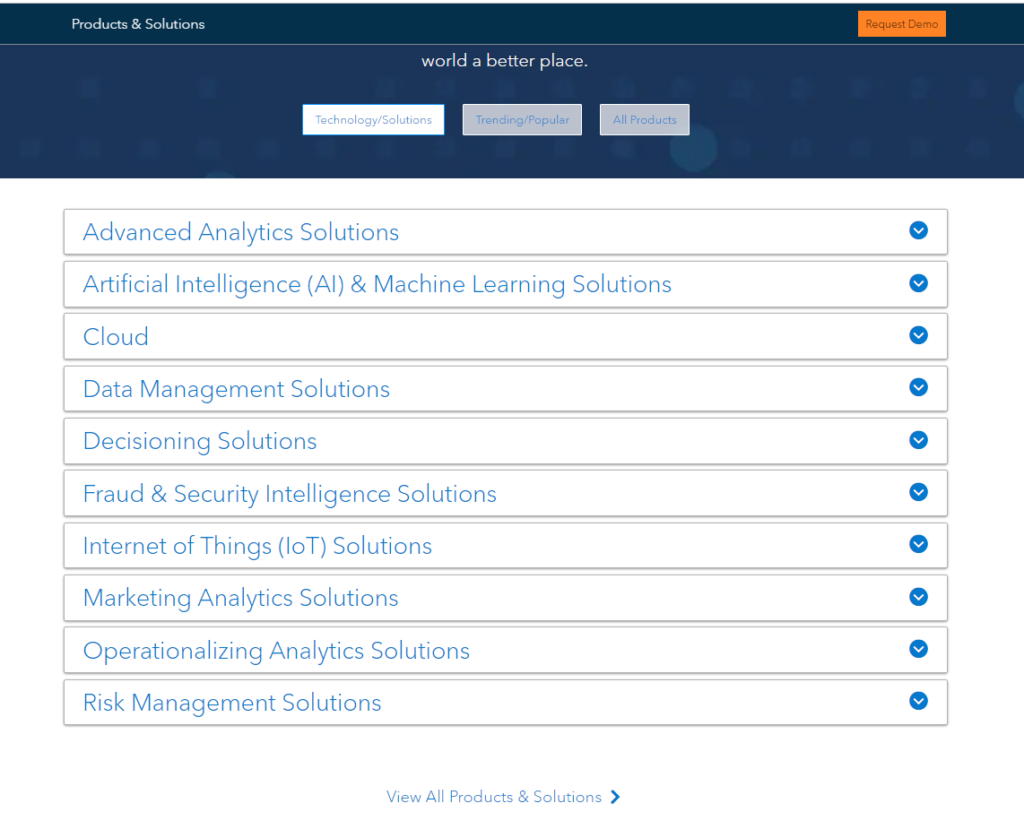
SAS is a complete package to perform analytical operations. Hence they have developed multiple products depending on the role and nature of the task you want to perform.
The SAS products are categorized into multiple groups considering technology, solutions, industry, etc.

We’re listing here the most common SAS products but not limited to:
- BASE SAS
- SAS EG
- SAS DI Studio
- SAS Management Console
- SAS Studio
- Enterprise Miner
- SAS Information Map Studio
- BI Dashboard
BASE SAS, SAS EG, and SAS Studio

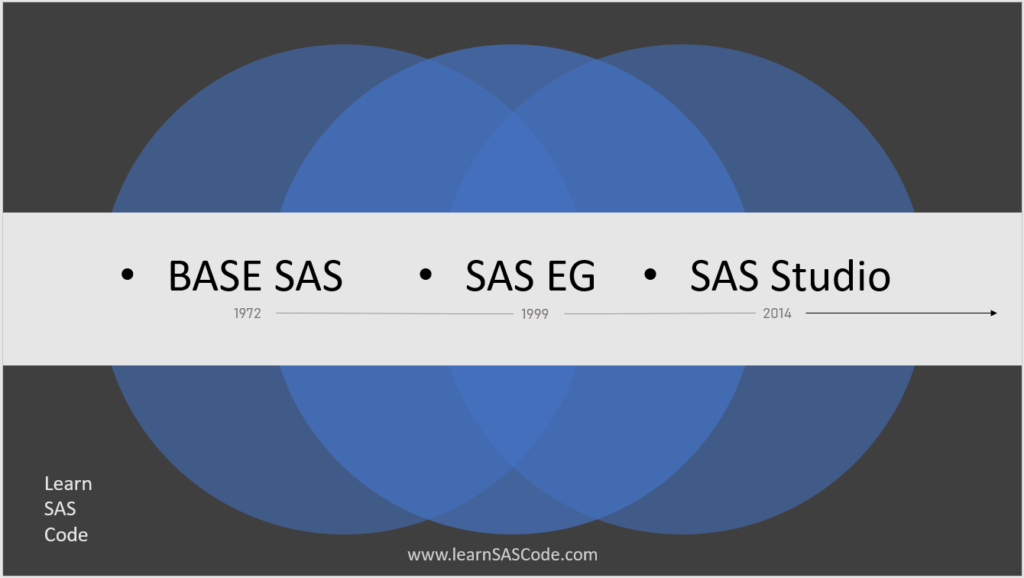
Initial days of SAS, the BASE SAS tool was widely used for writing SAS programs. Later SAS EG (Enterprise Guide) became more popular specially due to its drag and drop functionality. SAS EG was launched late 1999 and immediately became so popular.
Almost 14 years later, SAS Studio was launched in March 2014. There were lots of other tools introduced and they are equally popular but when it comes to writing hard core SAS programs, SAS studio is winning the battle.
In case if you do not know you can get SAS Studio access completely free and start learning SAS programming immediately. Learn how to get access to SAS Studio.
SAS studio is the present and the future. The integration of SAS Studio with SAS Viya is the killer combination. For the learning purpose we are demonstrating you SAS Studio Interface
SAS User Interface
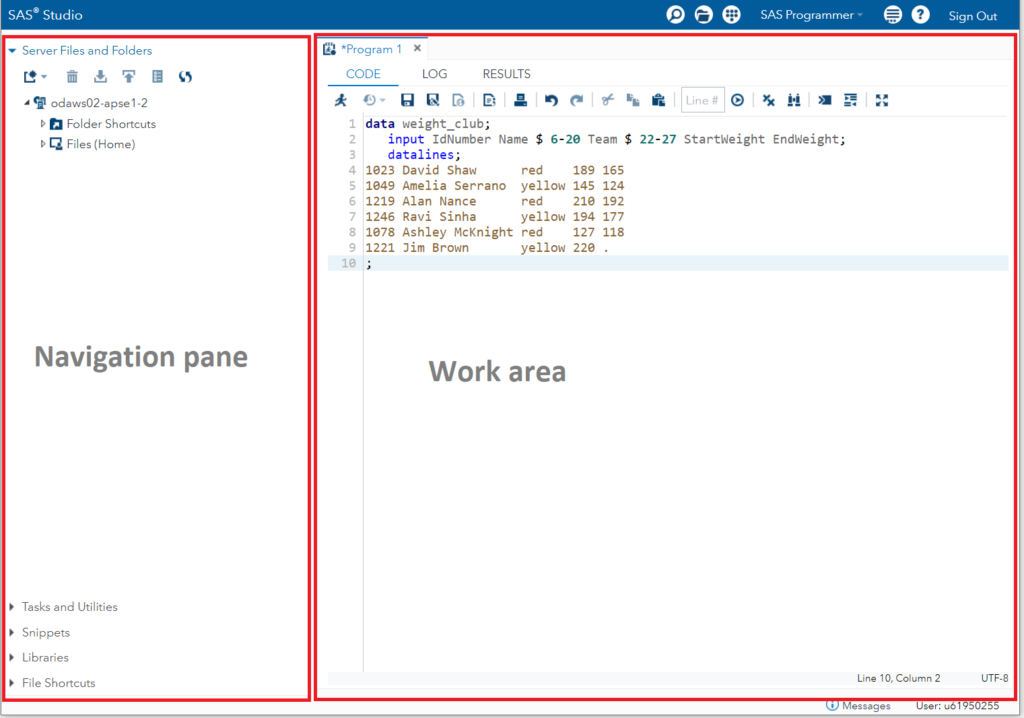
There are two different windows to perform various functions, do other activities simultaneously while running your SAS code. The first one is the Navigation pane and the other one is the Work area.
SAS Windows
- Navigation pane
- Work area

The Navigation pane is situated on the left side of the window where you see lots of tabs such as Folders, Tasks and utilities, Snippets, File shortcuts, etc.
The work area is neat and clean where you can write your SAS programs, execute them and see logs or output. The work area consists of three windows: CODE window, LOG window, and RESULTS window.
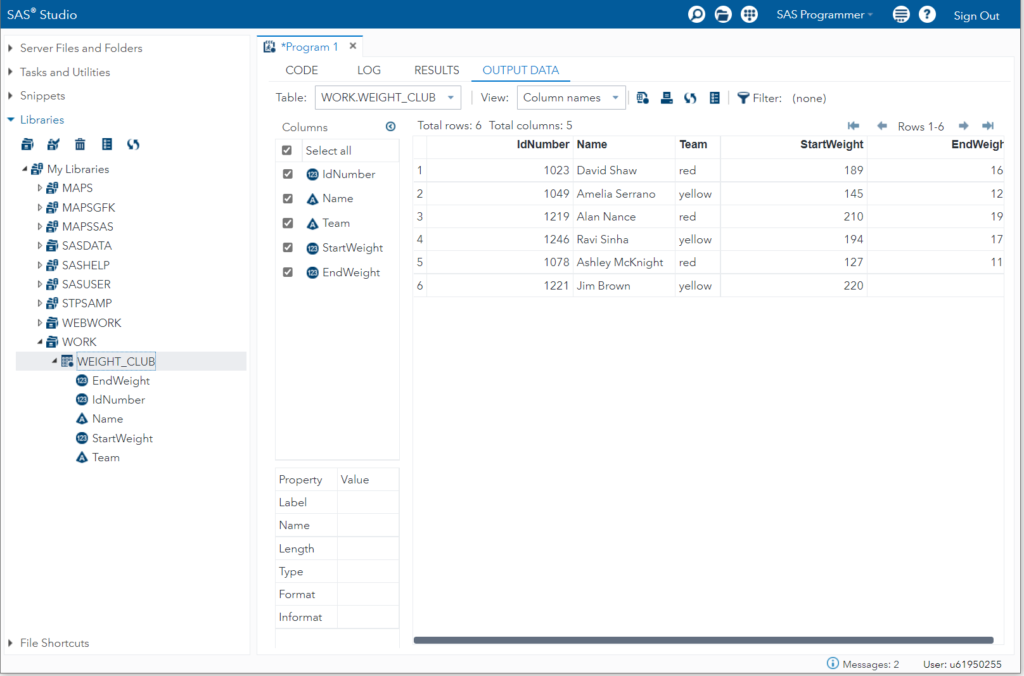
Let’s try to quickly run a simple SAS code to give you some glance of SAS user Interface. Below code will create a new work data set with name “weight_club”.
data weight_club;
input IdNumber Name $ 6-20 Team $ 22-27 StartWeight EndWeight;
datalines;
1023 David Shaw red 189 165
1049 Amelia Serrano yellow 145 124
1219 Alan Nance red 210 192
1246 Ravi Sinha yellow 194 177
1078 Ashley McKnight red 127 118
1221 Jim Brown yellow 220 .
;
run;

That’s all about the SAS user interface. The next SAS Studio Overview could be the perfect starting point for you to start learning SAS for beginners to advanced users.