The Google maps where we usually see the maps and details about the country, city, or any place. What if you could create the similar maps in SAS itself in the SAS Studio using BASE SAS code?
It’s pretty easy to create maps in SAS using the proc gmap procedure. It becomes even more simpler if you use the existing maps library dataset.
The MAPS library is similar to SAHELP, where you get ready-made datasets that are required for the GMAP procedure to draw maps that you want.
Although you can also create your own dataset depending on your own requirement to create customised maps.
The GMAP Procedure
The GMAP procedure produces two-dimensional (choropleth) or three-dimensional (block, prism, and surface) maps that show variations of a variable value with respect to an area. Map data sets and response data sets are used in the GMAP procedure.
Syntax
				/* proc gmap procedure syntax */

PROC GMAP MAP=map-data-set
DATA=response-data-set
<ALL>
<ANNOTATE=Annotate-data-set>
<DENSITY=0 ...6 | LOW | MEDIUM | HIGH>
<GOUT=<libref.>output-catalog>
<IMAGEMAP=output-data-set>
<LATLON>
<RESOLUTION=1 ...10 | AUTO | NONE>
<STRETCH>
<UNIFORM>;
    ID id-variable(s);
    AREA response-variable </ options>;
    BLOCK response-variable(s) </ options>;
    CHORO response-variable(s) </ options>;
    PRISM response-variable(s) </ options>;
    SURFACE response-variable(s) </ options>;
RUN;
QUIT;
The GMAP procedure can be used to perform the following tasks:
- Create maps
- Summarise data that vary by physical area
- Show trends and variations of data between geographic areas
- Highlight regional differences or extremes
There are 4 Types of Maps you can create in SAS using GMAP procedure as follows:
- Two-dimensional (choropleth)
- BLOCK Maps
- PRISM Maps
- SURFACE Maps
Each type of advanced Maps has been explained further in the article with the examples. Let’s start with creating basic maps in SAS Studio using the GMAP procedure.
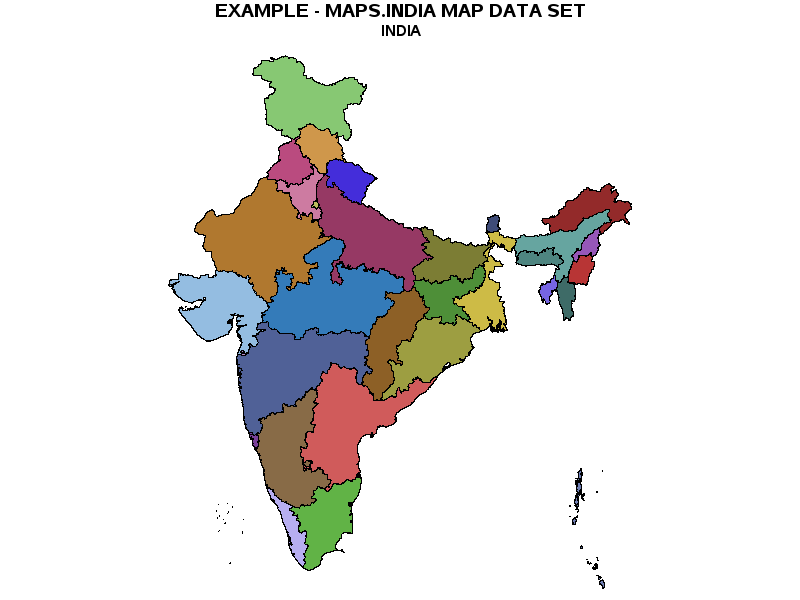
1. Create Two-dimensional (choropleth) Maps in SAS
The two-dimensional (choropleth) maps indicate levels of magnitude or response levels of the corresponding response variable by filling map areas with different colors and patterns.
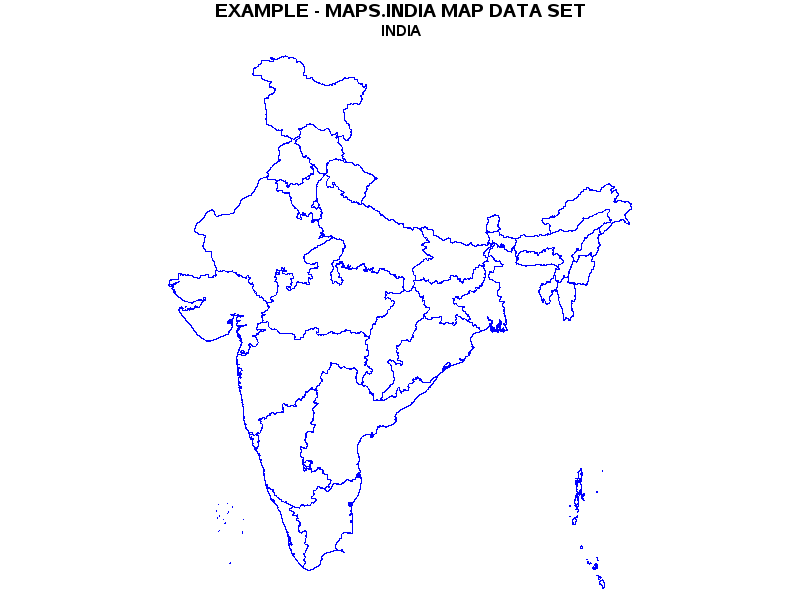
You can also produce a simple choropleth map that shows an outline of a map’s areas.
The following code creates an INDIA map using maps.india data set. For simplicity map-data-set and response-data-set are the same data set mentioned here.
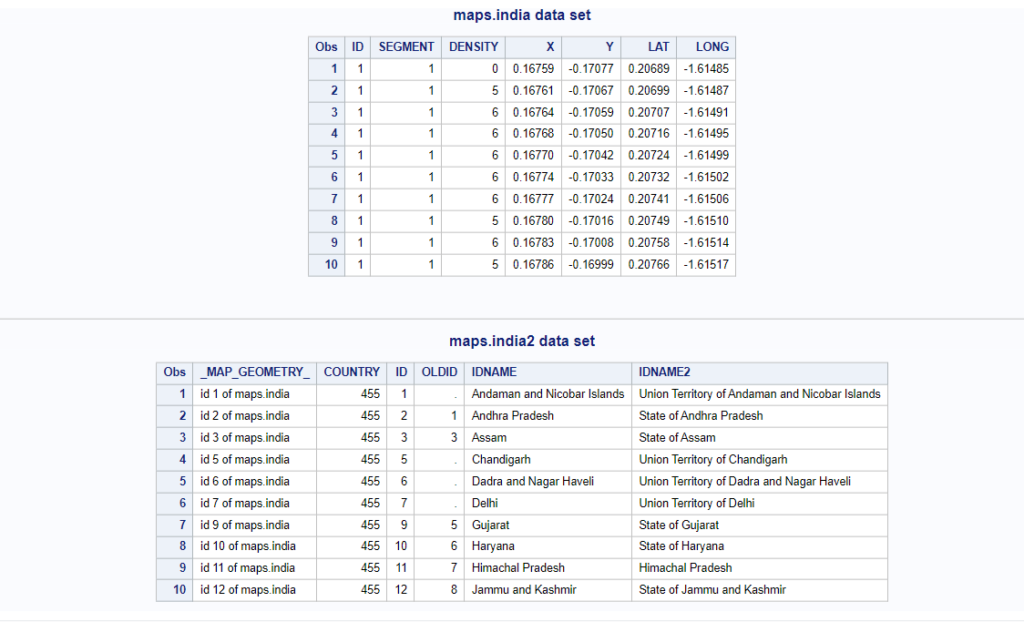
Lets see how data sets present under the maps library looks like by printing the first 10 observations of maps.india and maps.india2.
				/* print maps.india data set */
proc print data=maps.india(obs=10);
	title 'maps.india data set';
	run; quit;

/* print maps.india2 data set */
proc print data=maps.india2(obs=10);
	title 'maps.india2 data set';
	run; quit;
Now it’s time to draw the map using the proc gmap procedure in SAS.
				/* Create Maps with SAS */

title1 'EXAMPLE - MAPS.INDIA MAP DATA SET';
title2 'INDIA';

/* draw the map*/
proc gmap map=maps.india data=maps.india(keep=id) all;
	id id;
	choro id / nolegend discrete;
	run;
quit;
The empty map (without colors) can be created by adding a pattern statement with the following options (v=me):
pattern v=me c=blue r=62;
				/* Create empty Maps in SAS */

pattern v=me c=blue r=62; /* select an empty pattern (v=me) */

title1 'EXAMPLE - MAPS.INDIA MAP DATA SET';
title2 'INDIA';

/* draw the map*/
proc gmap map=maps.india data=maps.india(keep=id) all;
	id id;
	choro id / nolegend discrete;
	run;
quit;
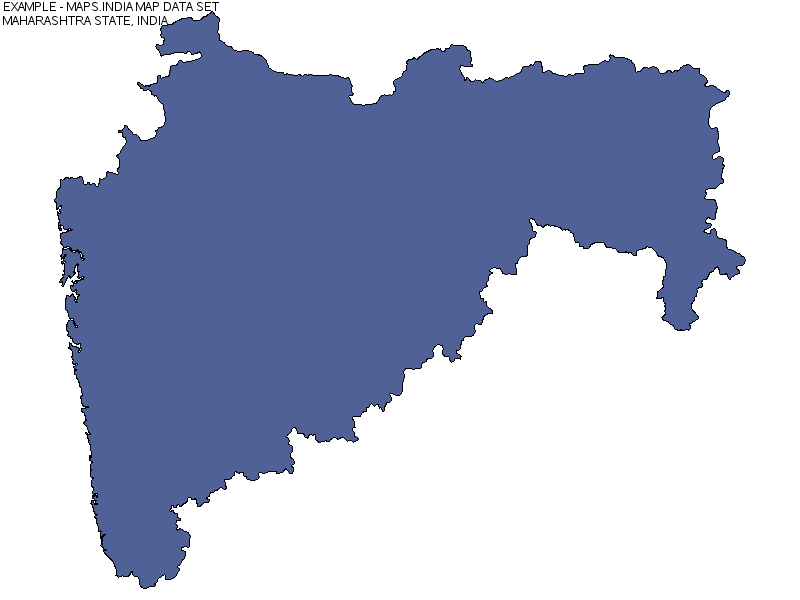
You could actually drill down and create a State Wise graph instead of an entire country map.
If you look at maps.india data set, you have values on ID columns that represent states. The ID vs State name mapping is available in maps.india2 data set.
So ID=16 represents MAHARASHTRA state. The following code creates a Maharashtra state map.
Create Maharashtra State Map
				/* draw MAHARASHTRA State Map */
proc gmap map=maps.india(where=(id eq 16)) data=maps.india(keep=id) all;
	id id;
	choro id / nolegend discrete;
	note ' EXAMPLE - MAPS.INDIA MAP DATA SET'
	j=l ' MAHARASHTRA STATE, INDIA';
	run;
quit;
You can also filter out data using the PROC GPROJECT procedure to create a state wise map.
You might not need this as simple where clause demonstrated in above example would be sufficient.
Just in case if you want to try a proc gproject procedure then here is the example that produces the exact same results as demonstrated in the previous example.
				/* filter data for Maharashtra state */
proc gproject data=maps.india out=maha;
	where id eq 16;
	id id;
run;

/* draw the map */
proc gmap map=maps.india data=maha(keep=id)  ;
	id id;
	choro id / nolegend discrete;
	note ' EXAMPLE - MAPS.INDIA MAP DATA SET'
	j=l ' MAHARASHTRA STATE, INDIA'
	j=l ' PROJECTED WITH'
	j=l ' PROC GPROJECT';
	run;
quit;

Map with Legend
If you have observed in the above examples, nolegend option is being used.
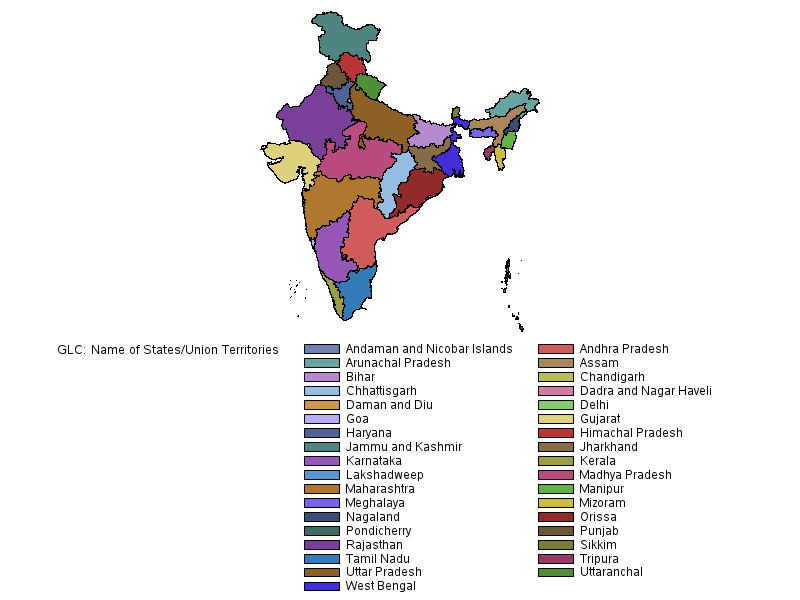
Now let’s create the map with the legend that has state name details. The data set maps.india doesn’t have a state name attribute.
You can use maps.india2 data set to fetch state names (IDNAME) using the unique state ID column.
So here map-data-set remains the same maps.india but you’ll use maps.india2 as response-data-set. You only need two columns “Id” & “IDNAME” from maps.india2 data set.
				/* Map with Legend */

proc gmap map=maps.india data=maps.india2(keep=ID IDNAME) ;
	id id;
	choro idname;
	run;
quit;
Map with Annotation
To add annotation to each state you need a state name which is already available in maps.india2 data set. You have already used the above Map with Legend example.
This is the extended version of Map with legend where you add a state name inside the map instead of legend.
You need to use the <ANNOTATE=Annotate-data-set> option to add annotation in the GMAP procedure. You don’t manually create <Annotate-data-set> data set, instead you use inbuilt sas macros in the beginning of your code.
- The %ANNOMAC macro which tells SAS to have the annotate macros ready to be used.
- The next step is calling the %MAPLABEL macro which will create the annotate dataset to be called in PROC GMAP in the annotate statement.
Syntax:
				%ANNOMAC;
%MAPLABEL (map-dataset, attr-dataset, output-dataset, label-var, id-list,
font=font_name,color=n,size=n,hsys=n);
The above syntax might be confusing to you. Refer the below explanation how I used this SAS macro to feed the values for %maplabel macro.
- map-dataset: maps.india
- attr-dataset: maps.india2
- output-dataset: annotateDS
- label-var: idname
- id-list: id
- font=’Albany AMT’
- color= black
- size= 1.5
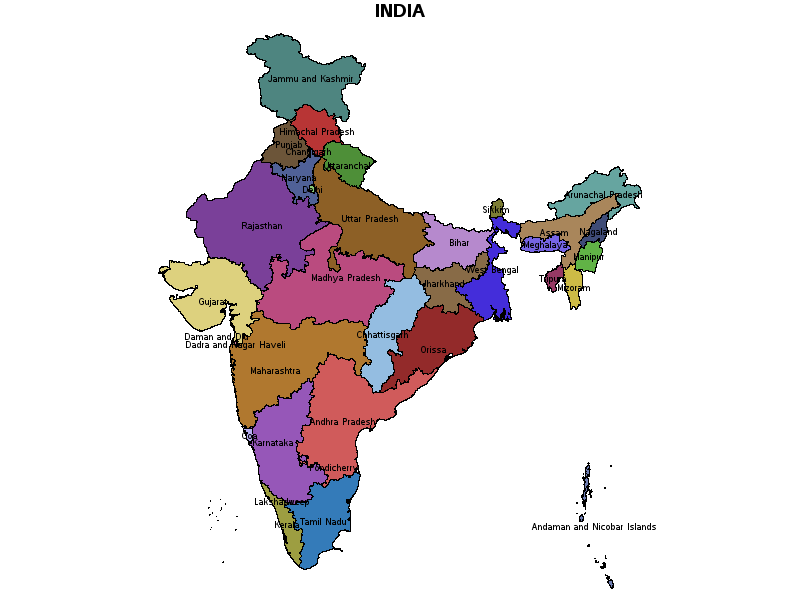
The following code creates INDIA map with the state names.
				/* Map with Annotation */

%ANNOMAC;
%MAPLABEL(maps.india, maps.india2, annotateDS, idname, id, font='Albany AMT',
	color=black, size=1.5);

title1 ' INDIA ';
proc gmap map=maps.india data=maps.india2(keep=ID IDNAME) ;
	id id;
	choro idname / annotate=annotateDS discrete nolegend;
	run;
quit;
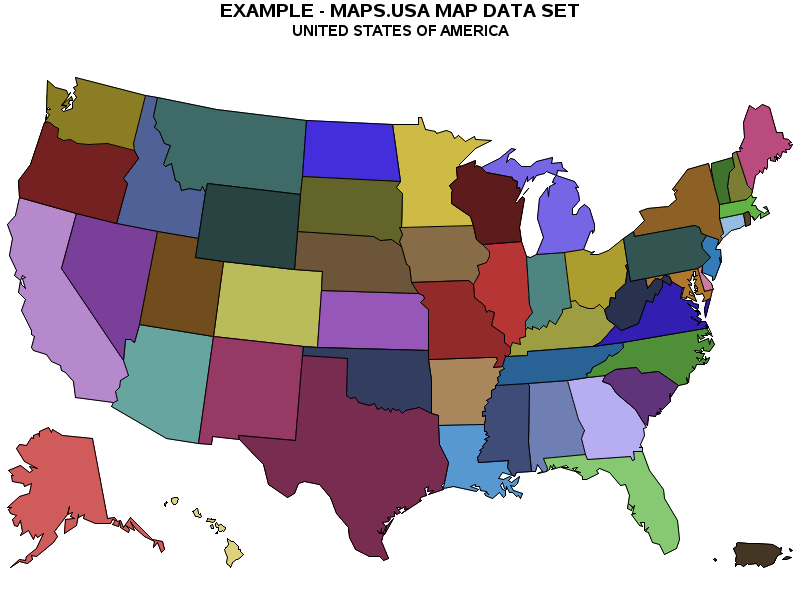
Create USA Map
Let’s create the USA map with the proc gmap procedure and maps.us & maps.us2 data sets.
The following code creates the entire USA map, and followed by the New York State Map.
The data set maps.us has a unique state id whereas state names are present in maps.us2 data set. Both data sets can be linked together using a state attribute.
				/* Create USA Map */

*pattern v=me ;
title1 'EXAMPLE - MAPS.USA MAP DATA SET';
title2 'UNITED STATES OF AMERICA';

/* draw the map */
proc gmap map=maps.us data=maps.us(keep=state) all;
	id state;
	choro state / nolegend discrete;
	run;
quit;
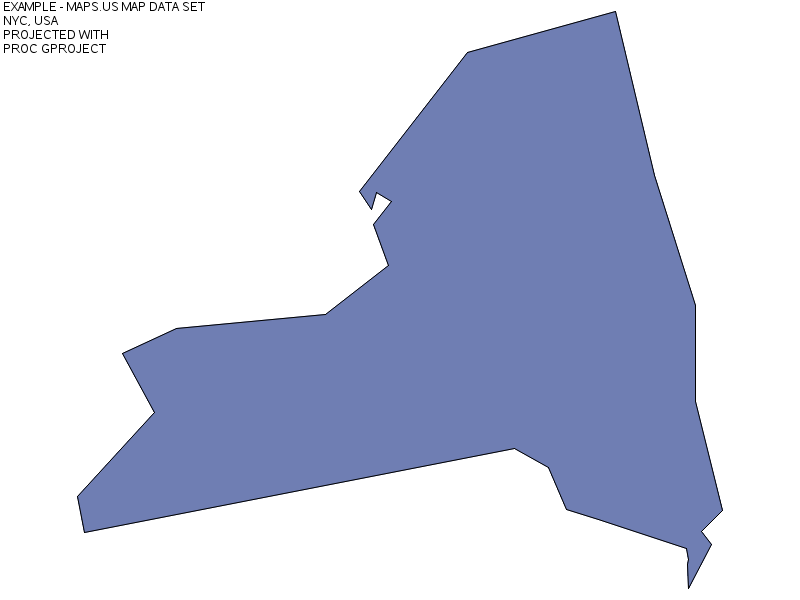
				/*** NYC State Map ***/

/* filter data for nyc */
proc gproject data=maps.us out=nyc;
	where state eq 36;
	id state;
run;

/* draw the map */
proc gmap map=maps.us data=nyc(keep=state)  ;
	id state;
	choro state / nolegend;
	note ' EXAMPLE - MAPS.US MAP DATA SET'
	j=l ' NYC, USA'
	j=l ' PROJECTED WITH'
	j=l ' PROC GPROJECT';
	run;
quit;
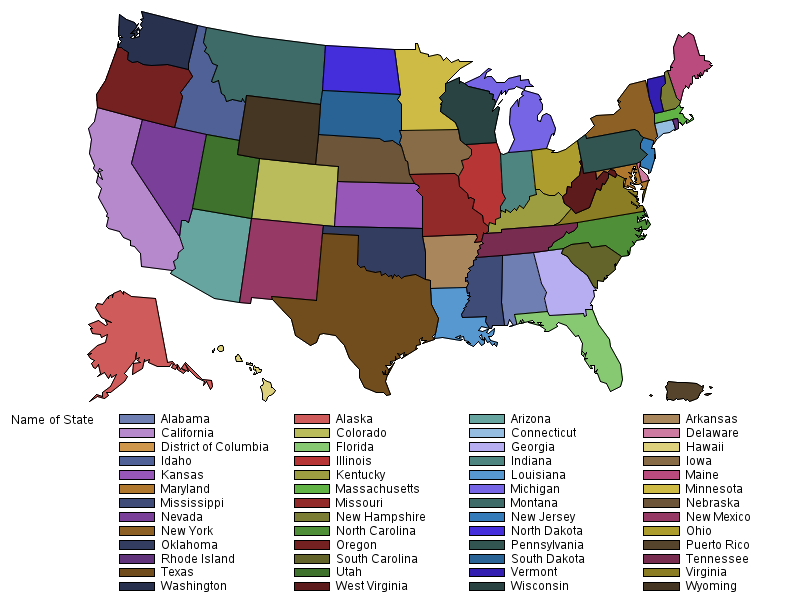
Before we add annotation that describes each state, let’s first create the Map with legend by using and mapping maps.us and maps.us2 data sets.
				/* Map with Legend */
proc gmap map=maps.us data=maps.us2(keep=state statename) ;
	id state;
	choro statename;
	run;
quit;
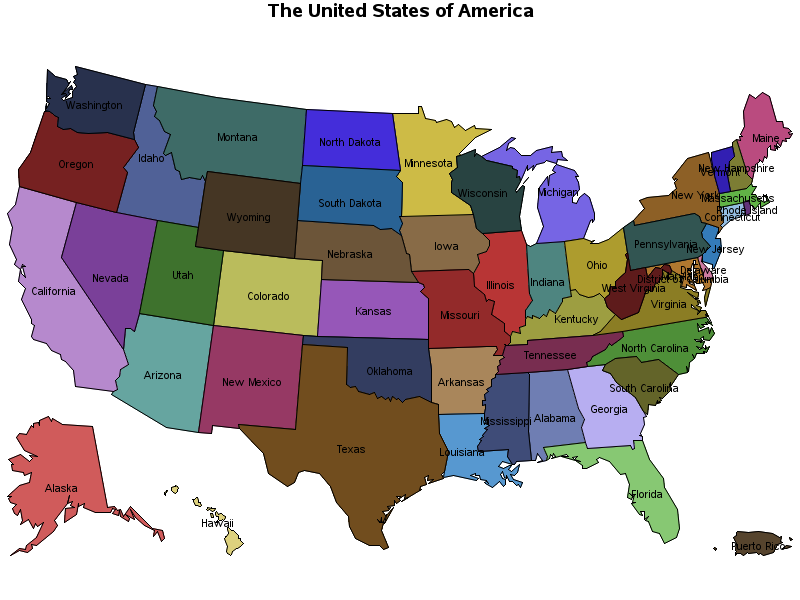
The USA Map with Annotation
It is the exact same process explained above that can be followed to create a USA map with annotation.
The following code uses sas macros %annomac & %maplabel with the required parameters to create annotation-data-set.
Further the same has been used in the proc gmap to create a map with annotation.
				/* the USA Map with Annotation */

%ANNOMAC;
%MAPLABEL(maps.us, maps.us2, annotateDS, statename, state, font='Albany AMT',
	color=black, size=1.8);

title1 ' The United States of America ';
proc gmap map=maps.us data=maps.us2(keep=state statename) ;
	id state;
	choro statename / annotate=annotateDS discrete nolegend;
	run;
quit;
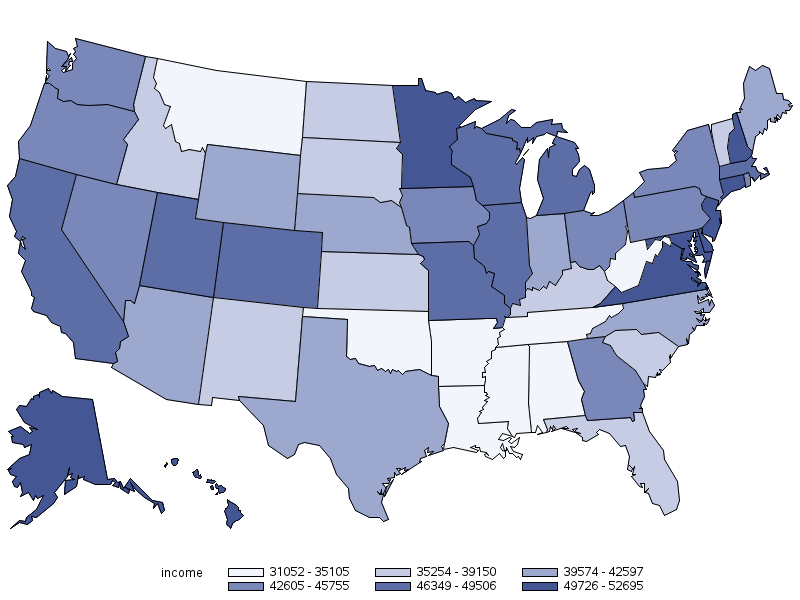
Create a Map that describes Each State’s average Income
This is one more example explaining how to create maps in SAS using the PROC GMAP procedure. You’ll also learn different types of maps: block maps, prism maps, and surface maps.
In this example you’ll use maps.us as map-data-set but manually created work.income data set as response-data-set.
- map-data-set: maps.us
- response-data-set: work.income
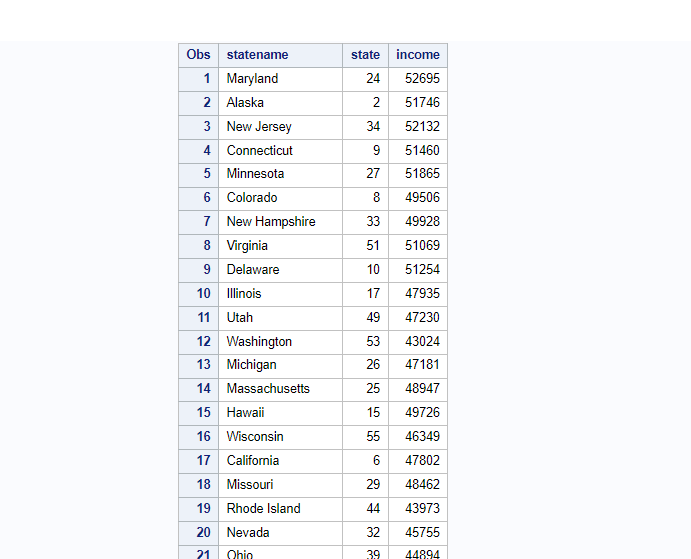
Let’s first create a work.income data set using datalines.
				/* create a sas data set */
data work.income;
	input statename $20. state income;
	datalines;
Maryland                24 52695
Alaska                   2 51746
New Jersey              34 52132
Connecticut              9 51460
Minnesota               27 51865
Colorado                 8 49506
New Hampshire           33 49928
Virginia                51 51069
Delaware                10 51254
Illinois                17 47935
Utah                    49 47230
Washington              53 43024
Michigan                26 47181
Massachusetts           25 48947
Hawaii                  15 49726
Wisconsin               55 46349
California               6 47802
Missouri                29 48462
Rhode Island            44 43973
Nevada                  32 45755
Ohio                    39 44894
Oregon                  41 45440
Iowa                    19 44993
Georgia                 13 43887
Pennsylvania            42 44842
Indiana                 18 41717
Vermont                 50 39150
New York                36 42605
Maine                   23 42597
Arizona                  4 42456
Texas                   48 40842
Nebraska                31 39574
North Carolina          37 39829
Kansas                  20 38705
Wyoming                 56 40026
District of Columbia    11 39752
Idaho                   16 38462
Florida                 12 38998
Kentucky                21 38186
South Carolina          45 38519
Alabama            	     1 35105
South Dakota      	    46 36172
Tennessee         	    47 34885
New Mexico        	    35 35254
Oklahoma          	    40 34445
North Dakota      		38 35349
Montana           		30 34045
Louisiana         		22 33219
Mississippi       		28 34528
Arkansas                 5 34293
West Virginia     		54 31052
;
run;
proc print data=income; run;
				proc gmap map=maps.us data=income;
	id state;
	choro income;
	run;
quit;
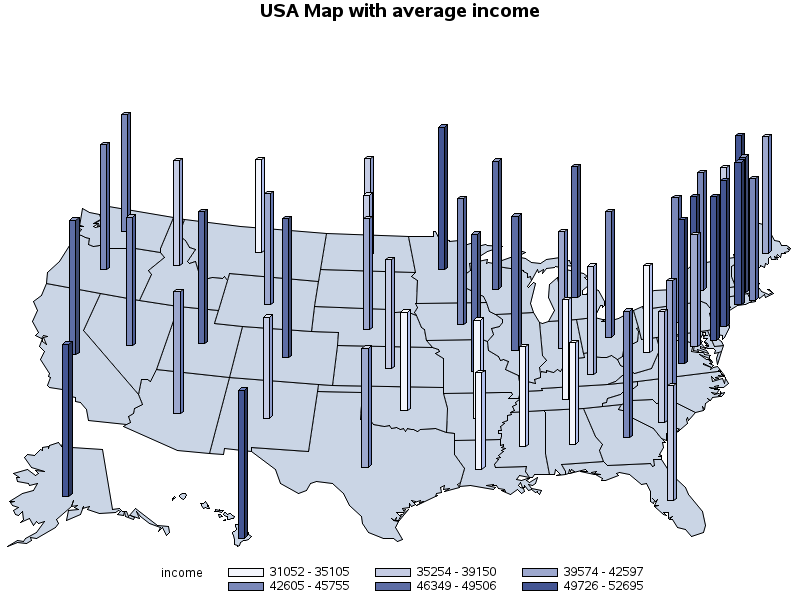
Type 2. Create Block Maps in SAS
The block maps display a block at the approximate centre of each map area to convey information about response variable values.
The height of each block is directly proportional to the value of the response variable.
The values of the response variable in the BLOCK statement are represented by the height of the blocks.
Example: In this example you’ll use maps.us as map-data-set and manually created work.income data set as response-data-set.
- map-data-set: maps.us
- response-data-set: work.income
				/* block map in SAS*/

title 'USA Map with average income' ;
proc gmap map=maps.us data=income;
	id state;
	block income / blocksize=1 relzero legend=legend1;
	run;
quit;
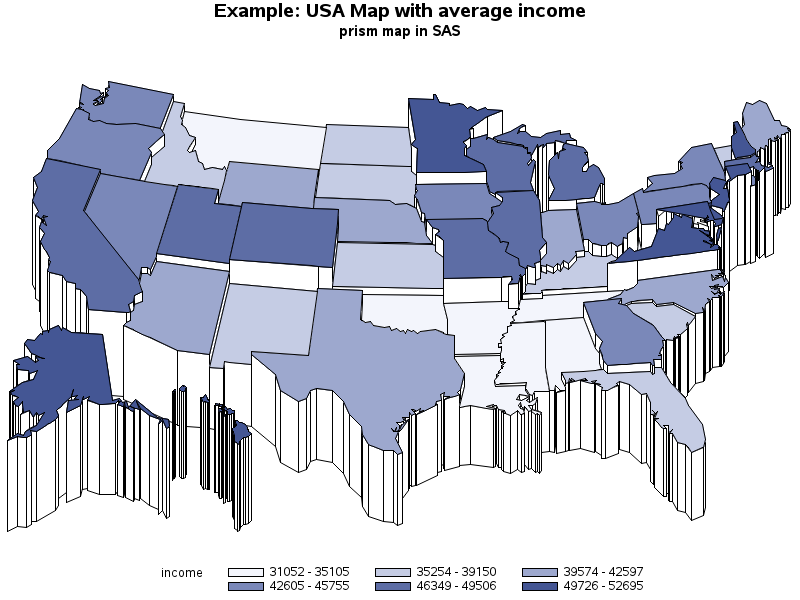
3. Create PRISM Maps in SAS
Prism maps use polyhedrons (raised polygons) in the shape of each map area to convey information about response variable values.
The height of each polyhedron, or prism, is directly proportional to the value of the response variable.
The values of the AREA variable are represented by the pattern of each map area. The values of the response variable in the PRISM statement are represented by the height of the map areas.
For example, The population of each country (the response value) is represented by the height of the country and the color of the country’s map area.
Example: The following example uses maps.us as map-data-set and manually created work.income data set as response-data-set.
- map-data-set: maps.us
- response-data-set: work.income
				/* prism map in SAS */
title1 'Example: USA Map with average income' ;
title2 'prism map in SAS';
proc gmap map=maps.us data=income ;
	id state;
	prism income /cdefault=yellow relzero;
	run;
quit;
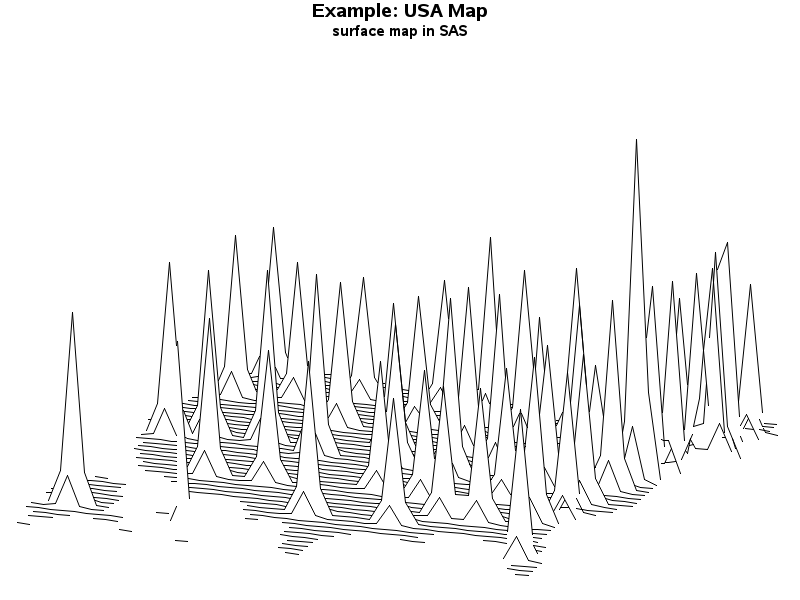
4. Create Surface Maps in SAS
Surface maps display a spike at the approximate center of each map area to convey information about response variable values.
The height of the spike corresponds to the relative value of the response variable, not to the actual value of the response variable.
For example, The growth rate for each country (the response value) is represented by the height of the spike for that country.
Example: The following example uses maps.us as map-data-set and manually created work.income data set as response-data-set.
- map-data-set: maps.us
- response-data-set: work.income
				/* surface map in SAS */

title1 'Example: USA Map' ;
title2 'surface map in SAS';
proc gmap map=maps.us data=income;
	id state;
	surface income / stat=sum ;
	run;
quit;
NOTE: Traditional map data sets have been available from the inception of SAS/GRAPH. These map data sets are resident in both the MAPS and MAPSSAS libraries.
The library reference (libref) MAPSSAS is set during system configuration and cannot be changed. MAPSSAS is provided for ease-of-use when using the MAPS= system option within SAS.
Use the MAPS= system option within SAS to point to either the GfK map data set library MAPSGFK or the traditional map data set library MAPSSAS. MAPS points to the MAPSSAS library by default.
TIP: The most current map data is in the GfK map data set library, MAPSGFK. For your new SAS programs, use the map data in MAPSGFK.
PSS- The Maps created in this article are for the demonstration purpose only. The coordinates and income might differ from actual values as the publicly available coordinate data has been used.
FAQ
100% sure thing.
It is absolutely possible to create beautiful maps in SAS studio using BASE SAS code.
The PROC GMAP is the procedure to use to draw maps in SAS.
To create basic maps in SAS, you can use PROC GMAP procedure. It allows you to plot data points on maps using various map files.
You can specify your data and the map file to use, and SAS will generate the map for you.
SAS provides map files for different regions, such as countries, states, and counties.
You can find these map files in the SAS Maps libraries such as “maps”, mapssas”, “mapsgfk”. These are the inbuilt libraries, available as soon as you launch your sas session.
Additionally, you can create custom map files using geographic data sources and tools like SAS Geographic Mapping for detailed and personalized maps.