You can easily create maps in SAS with the PROC GMAP procedure. In SAS studio you can create 2D maps, block maps, prism maps, surface maps, and so on.
If you’re not technical or don’t want to write a code then SAS offers user-friendly interfaces like SAS Visual Analytics, which allow you to create maps using a drag-and-drop approach.
You can create interactive maps and perform analyses without extensive programming knowledge.
Here is the basic syntax and one example of creating maps in SAS Studio using PROC GMAP procedure
				/* proc gmap syntax  */

PROC GMAP MAP=map-data-set
DATA=response-data-set
<ALL>
<ANNOTATE=Annotate-data-set>
<DENSITY=0 ...6 | LOW | MEDIUM | HIGH>
<GOUT=<libref.>output-catalog>
<IMAGEMAP=output-data-set>
<LATLON>
<RESOLUTION=1 ...10 | AUTO | NONE>
<STRETCH>
<UNIFORM>;
    ID id-variable(s);
    AREA response-variable </ options>;
    BLOCK response-variable(s) </ options>;
    CHORO response-variable(s) </ options>;
    PRISM response-variable(s) </ options>;
    SURFACE response-variable(s) </ options>;
RUN;
QUIT;
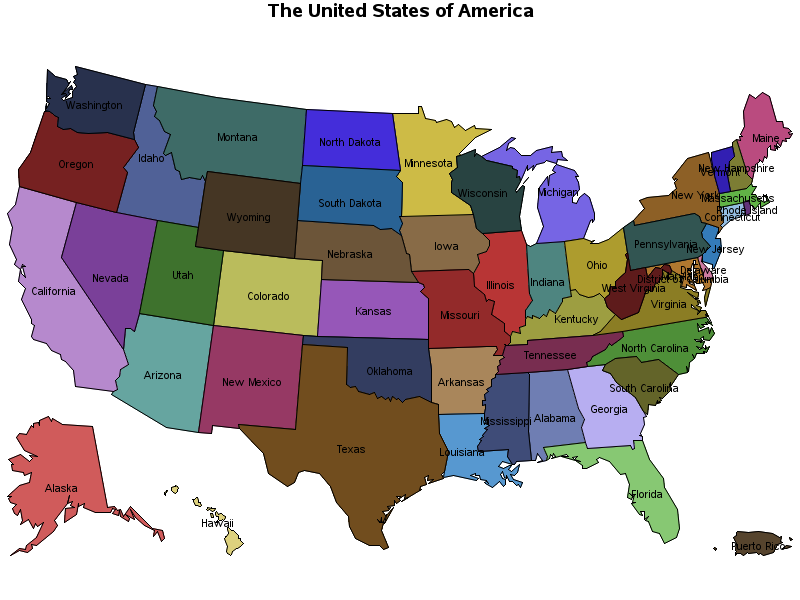
Example: Create the USA Map with Annotation using maps.us and maps.us2 data sets.
				/* Example: The USA Map*/

%ANNOMAC;
%MAPLABEL(maps.us, maps.us2, annotateDS, statename, state, font='Albany AMT',
	color=black, size=1.8);

title1 ' The United States of America ';
proc gmap map=maps.us data=maps.us2(keep=state statename) ;
	id state;
	choro statename / annotate=annotateDS discrete nolegend;
	run;
quit;
For more details about PROC GMAP or Creating different types of Maps in SAS Studio, check out this article.
Frequently Asked Questions (FAQ) about Creating Maps in SAS
Q1: What is SAS mapping and why is it important?
A1: SAS mapping refers to the process of creating geographical maps using SAS software. It’s crucial for businesses and researchers to visualize data spatially, enabling better analysis and decision-making by identifying patterns and trends across different regions.
Q2: How can I create basic maps in SAS?
A2: To create basic maps in SAS, you can use the PROC GMAP procedure. It allows you to plot data points on maps using various map files. You can specify your data and the map file to use, and SAS will generate the map for you.
Q3: Where can I find map files for SAS mapping?
A3: SAS provides map files for different regions, such as countries, states, and counties. You can find these map files in the SAS Maps libraries such as “maps”, “mapssas”, “mapsgfk”. These are the inbuilt libraries available immediately when you launch your SAS session.
Additionally, you can create custom map files using geographic data sources and tools like SAS Geographic Mapping for detailed and personalised maps.
Q4: What are the essential SAS commands for mapping?
A4: Some essential SAS commands for mapping include PROC GMAP for creating maps, MAPID and ID statements to identify data points, CHORO statement for choropleth maps, and ANNOTATE dataset for adding custom annotations to the maps.
You can refer to the proc gmap syntax mentioned earlier in the article.
Q5: Can I customise the appearance of my maps in SAS?
A5: Yes, you can customise the appearance of your maps in SAS. You can modify colours, legends, data labels, and map symbols using various options within the PROC GMAP procedure. Additionally, you can use the STYLEATTRS statement to customise the style elements of your map.
Check out more examples here and here!
Q6: How can I overlay data on existing maps in SAS?
A6: To overlay data on existing maps, you can use the OVERLAY statement in PROC GMAP. This allows you to combine multiple map layers and plot data points on them. You need to specify the map data and data to overlay, and SAS will create the composite map for you.
Q7: Is it possible to create interactive maps in SAS?
A7: Yes, SAS enables you to create interactive maps using SAS Visual Analytics. With SAS Visual Analytics, you can create dynamic and interactive maps that allow users to explore the data visually. You can add filters, drill-down capabilities, and tooltips to enhance the interactivity of your maps.
Q8: Are there any online resources or communities for SAS enthusiasts?
A8: Yes, there are online resources and communities where SAS enthusiasts can connect, share knowledge, and seek help. Websites like learnSASCode, SAS Communities and SAS Support Forums have dedicated sections for mapping-related discussions.
Additionally, SAS documentation and tutorials provide in-depth resources for learning SAS mapping techniques.
Q9: Can SAS mapping handle real-time data for live updates on maps?
A9: Yes, SAS can handle real-time data for live updates on maps. SAS Event Stream Processing (ESP) allows you to process and analyze streaming data in real-time.
You can integrate ESP with SAS mapping procedures to create dynamic maps that update in real-time based on incoming data streams.
Q10: Is there a limit to the size of the data I can visualize on maps in SAS?
A10: The size of the data you can visualize on maps in SAS depends on your system’s memory and processing power.
SAS is designed to handle large datasets, but extremely large datasets may require optimized data processing techniques.
It’s advisable to consult SAS documentation and performance tuning guidelines for handling large datasets efficiently.
Q11: Can I create maps in SAS without programming knowledge?
A11: Yes, SAS offers user-friendly interfaces like SAS Visual Analytics, which allow you to create maps using a drag-and-drop approach.
You can create interactive maps and perform analyses without extensive programming knowledge.
Q12: How can I add thematic data to my SAS maps?
A12: You can add thematic data to your SAS maps using the CHORO statement in PROC GMAP.
This statement allows you to shade areas on the map based on the values of a specified variable, creating choropleth maps that represent data variations across regions.
Q13: Does SAS support geocoding for address-level mapping?
A13: Yes, SAS provides geocoding capabilities through PROC GEOCODE. It allows you to convert addresses into geographic coordinates, enabling you to create maps at a detailed, address-level granularity.
Q14: Can I export SAS maps to other file formats like PDF or image files?
A14: Yes, you can export SAS maps to various file formats, including PDF, PNG, JPEG, and GIF.
You can use the appropriate output options in SAS procedures to save your maps in the desired file format.
Q15: How can I create heat maps in SAS?
A15: You can create heat maps in SAS using PROC KDE (Kernel Density Estimation) to estimate the density of points in a geographical area.
By visualizing this density estimation, you can create heat maps that show areas of high and low point concentration.
Q16: Is there a way to animate data on maps in SAS?
A16: Yes, SAS supports animation of data on maps. You can create animated maps using SAS Visual Analytics, allowing you to display changes in data over time. This is especially useful for visualizing temporal trends and patterns.
Q17: Can SAS maps be integrated into web applications?
A17: Yes, SAS maps can be integrated into web applications. SAS provides APIs and libraries that allow developers to embed SAS maps into web applications, enabling seamless visualization of data for online users.
Q18: How can I create custom map templates in SAS?
A18: You can create custom map templates in SAS by modifying the default styles and attributes in SAS map files. Additionally, you can use PROC TEMPLATE to create customized map templates tailored to your specific visualization requirements.
Q19: Does SAS provide support for 3D mapping?
A19: Yes, SAS supports 3D mapping through SAS Visual Analytics. You can create 3D maps to visualize data in a three-dimensional space, providing a unique perspective for analyzing spatial patterns and relationships.
Q20: Are there any best practices for optimizing the performance of SAS maps?
A20: Yes, there are several best practices for optimizing the performance of SAS maps, including optimizing your data sources, reducing the complexity of your maps, and utilizing appropriate indexing techniques.
SAS documentation provides detailed guidelines on optimizing map performance, ensuring efficient and responsive map visualizations. You can also refer SAS tutorials available at learnSASCode.com