The PROC MEANS procedure summarises data in descriptive statistics for variables across all the observations as well as within the groups of observations.
You can compute statistics like calculating mean, standard deviation, minimum and maximum values, and many more statistical calculations.
For example, PROC MEANS does the following:
- calculates descriptive statistics
- estimates quantiles, which includes the median
- calculates confidence limits for the mean
- identifies extreme values
- performs a t test
PROC MEANS
The PROC MEANS is a basic procedure within BASE SAS used primarily for answering questions about quantities (How much?, What is the average?, What is the total?, etc.)
PROC MEANS can also be used to conduct some basic statistical analysis.
Syntax:
				proc means data= dataset_name <options>;
     class <columns>;
     var <columns>;
     output <options>
run;
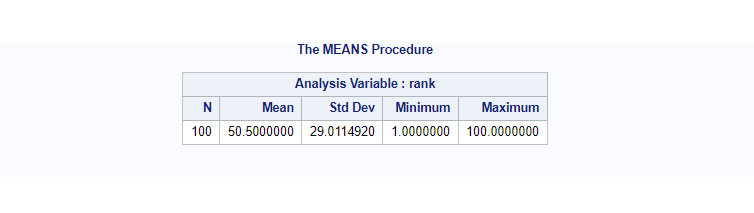
We starts with a simple example and use the proc means procedure with default options.
The data set that PROC MEANS analyzes contains the integers 1 through 100. The output reports the number of observations, the mean, the standard deviation, the minimum value, and the maximum value.
				/* create a new dataset with rank 1 to 100*/
data OnetoHundred (keep=rank);
	do i=1 to 100;
		rank=i;
		output;
	end;
run;
				/* proc means with default options */

proc means data=OnetoHundred;
run;
Now it’s time to go deeper and explore more complex use cases where proc means can be used in SAS with its various options.
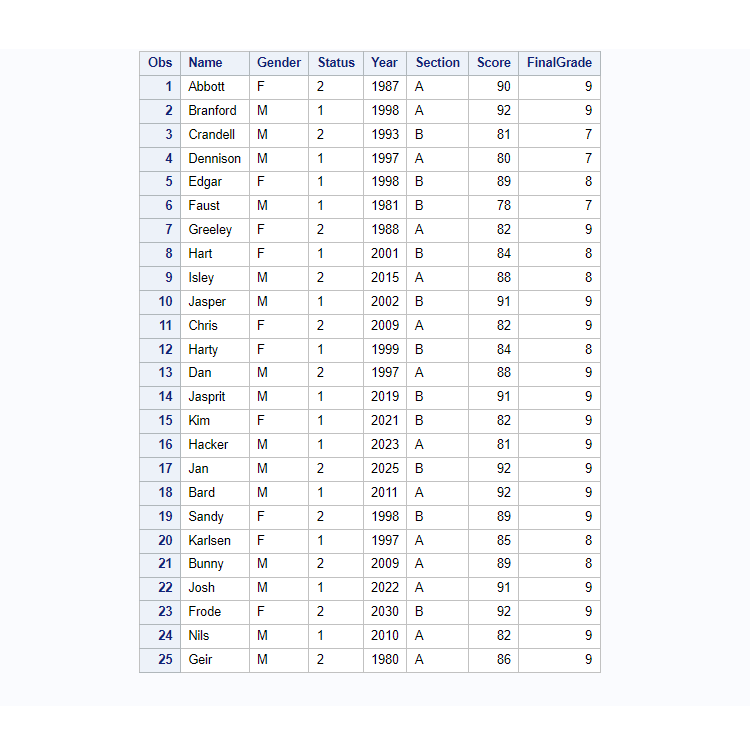
This is the dataset (work.grade) we’ll use to learn more about proc means in SAS. So let’s create a new dataset in the work library.
				/* Create a new sas dataset */

data work.grade;
	input Name $ 1-8 Gender $ 11 Status $13 Year $ 15-18 Section $ 20 Score 22-23
		FinalGrade 25-25;
	label Name=Name Gender=Gender Status=Status Year=Year Section=Section
		Score=Score FinalGrade=FinalGrade;
	datalines;
Abbott    F 2 1987 A 90 9
Branford  M 1 1998 A 92 9
Crandell  M 2 1993 B 81 7
Dennison  M 1 1997 A 80 7
Edgar     F 1 1998 B 89 8
Faust     M 1 1981 B 78 7
Greeley   F 2 1988 A 82 9
Hart      F 1 2001 B 84 8
Isley     M 2 2015 A 88 8
Jasper    M 1 2002 B 91 9
Chris     F 2 2009 A 82 9
Harty     F 1 1999 B 84 8
Dan       M 2 1997 A 88 9
Jasprit   M 1 2019 B 91 9
Kim       F 1 2021 B 82 9
Hacker    M 1 2023 A 81 9
Jan       M 2 2025 B 92 9
Bard      M 1 2011 A 92 9
Sandy     F 2 1998 B 89 9
Karlsen   F 1 1997 A 85 8
Bunny     M 2 2009 A 89 8
Josh      M 1 2022 A 91 9
Frode     F 2 2030 B 92 9
Nils      M 1 2010 A 82 9
Geir      M 2 1980 A 86 9
;
run;
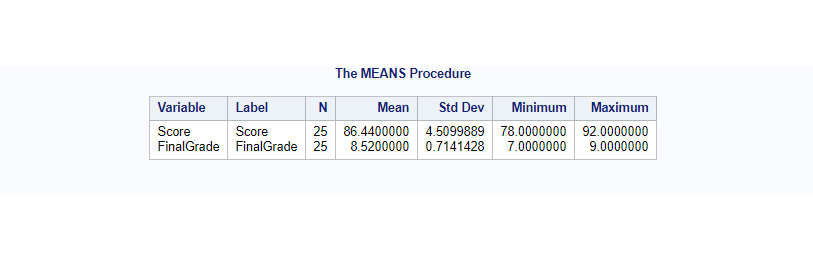
				/* proc means on grade dataset */

proc means data=grade;
run;
BASIC Statistics using PROC MEANS
In the proc means procedure you have the DATA= option where you need to specify the dataset you want to use. In the VAR= option, you need to refer to the numeric variables you want to analyse. You cannot refer to character variables in the VAR statement.
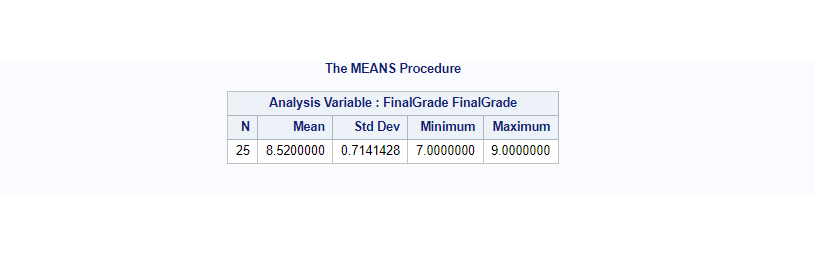
With the below example you can explore statistics on column names specified after var=option. Here we only want to see mean, std deviation, min and max statistics on column FinalGrade.
				/* run statistics on FinalGrade variable */

proc means data=grade;
   var FinalGrade;
run;
Descriptive Statistic Keywords
Here are statistical options available to use along with proc means.
| Statistical Options | Description |
|---|---|
| N | Number of non-missing values |
| NMISS | Number of missing values |
| MAX | Maximum |
| MIN | Minimum |
| MEAN | Average |
| VAR | Variance |
| SUM | Sum of the |
| STDDEV|STD | Standard Deviation |
| RANGE | Maximum minus Minimum |
| STDERR | Standard Error of the Mean |
| CV | Coefficient of Variation |
Quantile Statistic Keywords
| Statistical Options | Description |
|---|---|
| MEDIAN|P50 | Median or 50th Percentile |
| P1 | 1st Percentile |
| P5 | 5th Percentile |
| P10 | 10th Percentile |
| Q1|P25 | 1st Quartile or 25th Percentile |
| Q3|P75 | 3rd Quartile or 75th Percentile |
| P90 | 90th Percentile |
| P95 | 95th Percentile |
| P99 | 99th Percentile |
| QRANGE | Interquartile Range (Q3 – Q1) |
Hypothesis Statistic Keywords
| Statistical Options | Description |
|---|---|
| PROBT | two-tailed p-value for Student’s t statistic |
| T | Student’s t statistic |
Limit Descriptive Statistics
Let’s say you want to know two statistics, missing and non missing value on Score and FinalGrade columns from the Grade dataset.
				/* Descriptive Statistics on Score & FinalGrade */

proc means data=grade n nmiss;
	var Score FinalGrade;
run;
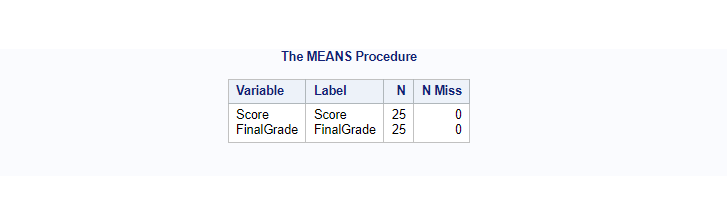
PS- Observe the output where N indicates no of non-missing values and NMISS indicates number of missing values.
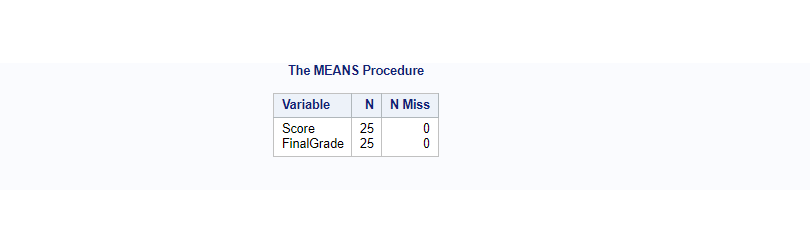
NOLABLELS in PROC MEANS
In the above output label column is not necessary. You can delete that column by specifying NOLABEL option in the proc means.
				proc means data=grade n nmiss NOLABELS;
	var Score FinalGrade;
run;
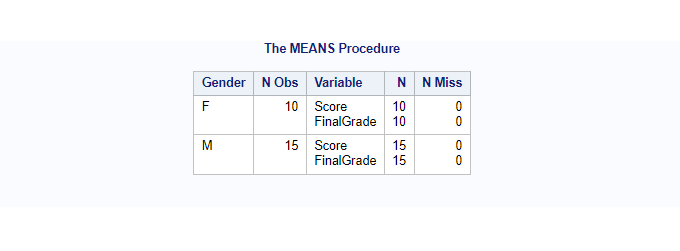
Group by Analysis
You can group and classify statistics by Gender using the CLASS statement in proc means. It’s pretty much equivalent to group by statement in the proc sql.
				proc means data=grade n nmiss NOLABELS;
	class Gender;
	var Score FinalGrade;
run;
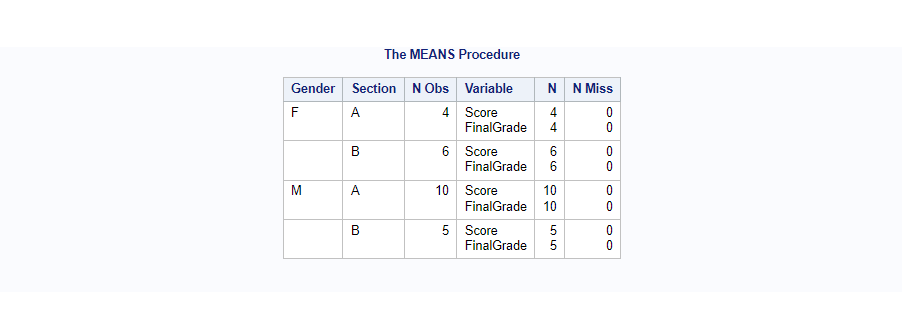
Grouping on two or more variables
You can add one more layer of classification by adding columns after the class statement. In this example let me add columns Gender followed by Section.
				proc means data=grade n nmiss NOLABELS;
	class Gender Section;
	var Score FinalGrade;
run;
If you don’t want to see the “N Obs” (Number of observations) column from the output then it can be deleted using the NONOBS option.
				proc means data=grade n nmiss NOLABELS nonobs;
	class Gender Section;
	var Score FinalGrade;
run;
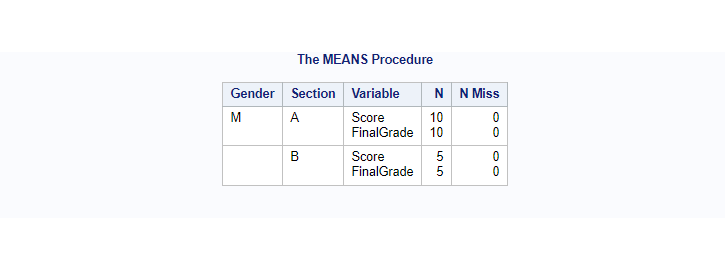
Add WHERE Clause
You can filter out data using where clause followed by filter condition. In this example let’s say you want to only see statistics for Male candidates.
				proc means data=grade n nmiss NOLABELS nonobs;
	where Gender = 'M';
	class Gender Section;
	var Score FinalGrade;
run;
The where clause can also be shifted after data= <option>
				proc means data=grade(where=(Gender='M')) n nmiss NOLABELS nonobs;
	class Gender Section;
	var Score FinalGrade;
run;
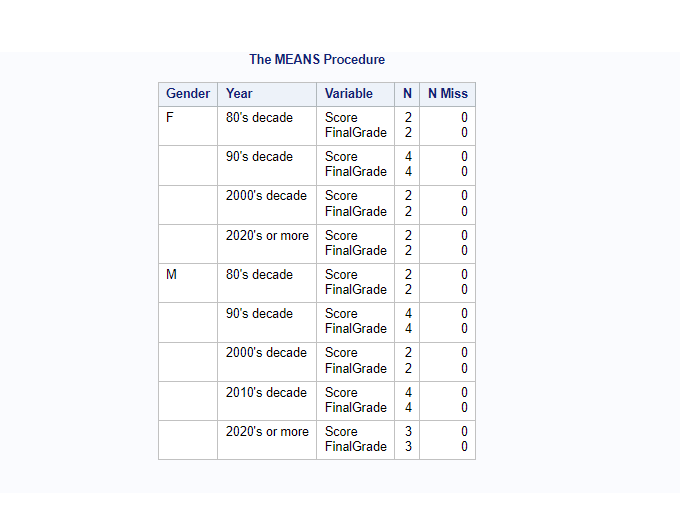
Format in PROC MEANS
Formats can be used with the proc means. Let’s create a user defined format for column YEAR and use that with the proc means procedure.
				/* Use user defined format in proc means */

proc format;
value $YEAR
'1980'-'1989' = "80's decade"
'1990'-'1999' = "90's decade"
'2000'-'2009' = "2000's decade"
'2010'-'2019' = "2010's decade"
'2020'-'2099' = "2020's or more";
run;

proc means data=grade n nmiss NOLABELS nonobs;
	class Gender YEAR;
	format Year $YEAR.;
	var Score FinalGrade;
run;
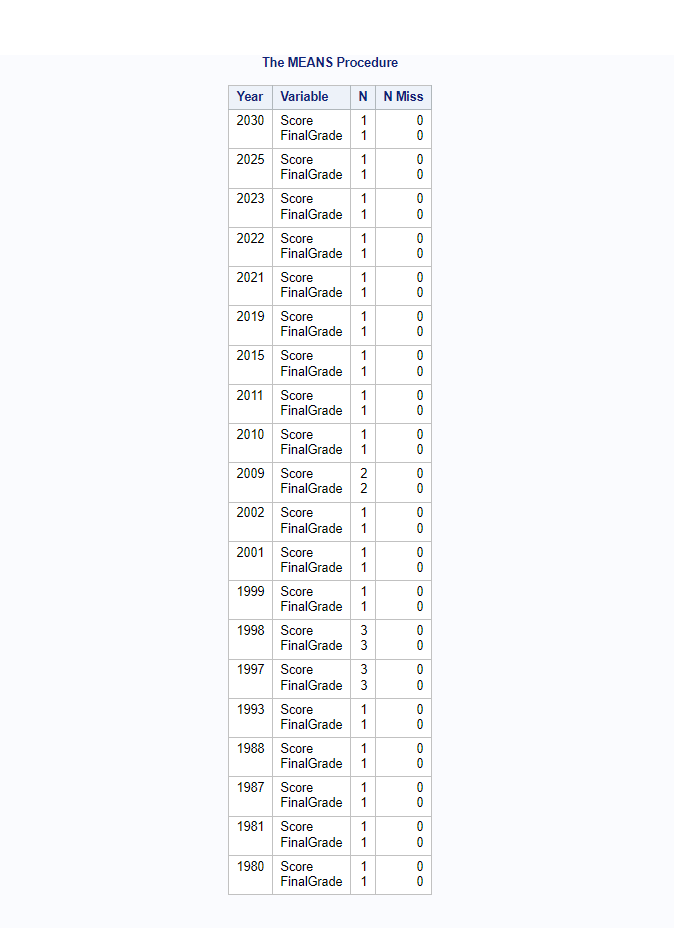
Sort the Output
The DESCENDING option after the class variable name indicates that statistics will be calculated and displayed by descending order on the class variable.
				proc means data=grade n nmiss NOLABELS nonobs;
	class Year / descending;
	var Score FinalGrade;
run;
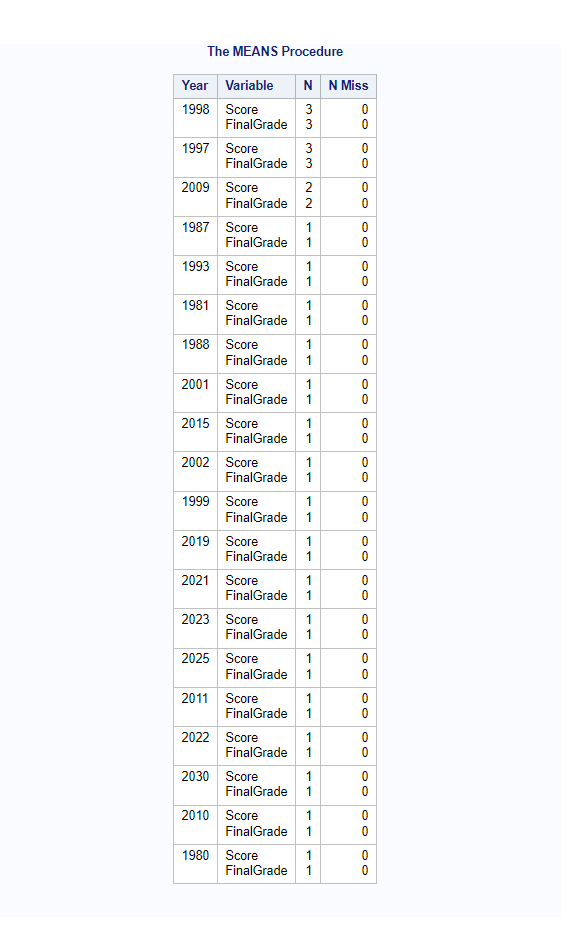
Instead of displaying the results in “sort order” of the values of the Classification Variable (s) which you have specified in the CLASS Statement, order the results by frequency order using the ORDER=FREQ option in the CLASS Statement.
				proc means data=grade n nmiss NOLABELS nonobs;
	class Year / Order = FREQ;
	var Score FinalGrade;
run;
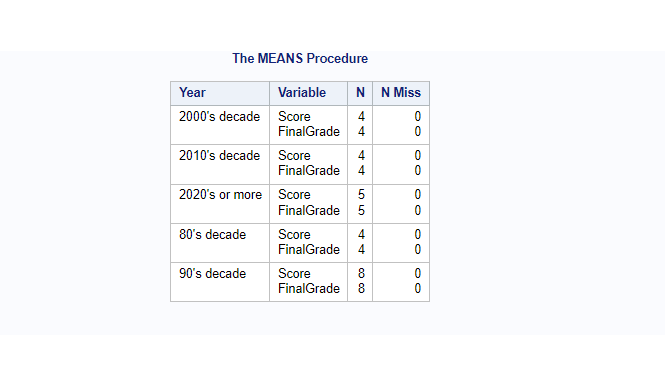
It is also possible to order the results by formatted values for classification variables.
				proc means data=grade n nmiss NOLABELS nonobs;
	class Year / order=formatted;
		format Year $YEAR.;
	var Score FinalGrade;
run;
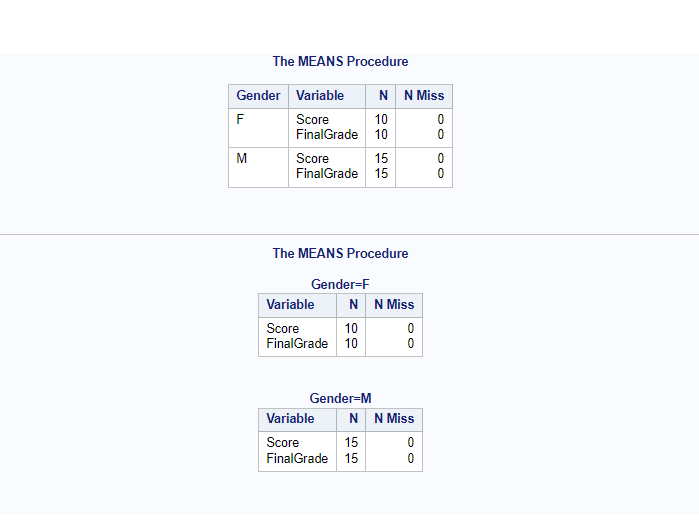
Difference between Class and By Statement in PROC MEANS
The CLASS statement returns analysis for a classification (group) variable in a single table whereas BY statement returns the analysis for a grouping variable in separate tables.
There is another difference: the CLASS statement does not require the classification variable to be pre-sorted whereas the BY statement demands sorting.
				/* CLASS and BY statement */

/* class statement*/
proc means data=grade n nmiss NOLABELS nonobs;
	class Gender ;
run;


proc sort data=Grade; by Gender;
run;

/*by statement */
proc means data=grade n nmiss NOLABELS nonobs;
	by Gender ;
run;
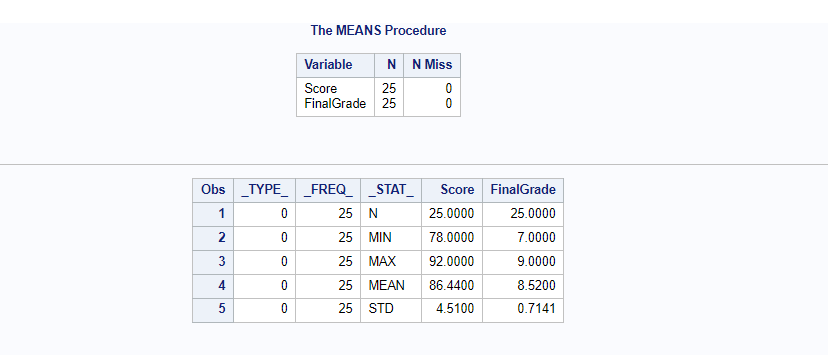
Create Output dataset
				/* Create output dataset */
proc means data=grade n nmiss NOLABELS;
	var Score FinalGrade;
	output out=grade_proc_means ;
run;

proc print data=grade_proc_means;
run;
Output dataset with selected stats. For example lets calculate stats for mean and median on both the Score and FinalGrade columns.
				/* mean and median */

proc means data=grade n nmiss NOLABELS;
	var Score FinalGrade;
	output out=grade_proc_means mean= median= /autoname ;
run;
proc print;

In the above output dataset variable names are auto-generated. It’s possible to customize variable names of a output dataset by specifying it after mean= & median=options.
				/* Give custom names to variables in output dataset. */

proc means data=grade n nmiss NOLABELS;
	var Score FinalGrade;
	output out=grade_proc_means
    mean=custScore_mean custFinalGrade_mean median =custScore_median custFinalGrade_median ;
run;
proc print;

If you want to delete those _TYPE_ and _FREQ_ columns from the output dataset then it can be done using keep= and drop= statement.
				/* Drop or keep _type_ and _freq_ columns */
proc means data=grade n nmiss NOLABELS;
	var Score FinalGrade;
	output out=grade_proc_means(drop = _type_ _freq_)
    mean=custScore_mean custFinalGrade_mean median =custScore_median custFinalGrade_median  ;
run;
proc print;
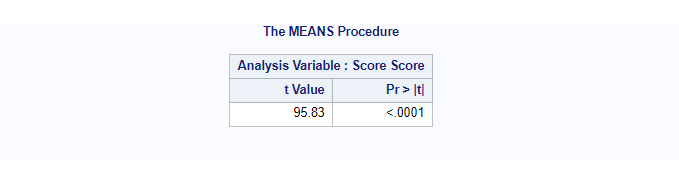
Sample T-test
You can perform a hypothesis testing using sample T test with proc means.
				/* sample T test */

proc means data=grade t prt;
	var Score;
run;
- Null Hypothesis – Mean of Score variable is equal to 0
- Alternative Hypothesis – Mean of Score variable is not equal to 0.
The PRT option returns p-value which implies the lowest level of significance at which we can reject the null hypothesis. Since p-value is less than 0.05, we can reject the null hypothesis and conclude that mean is significantly different from zero.
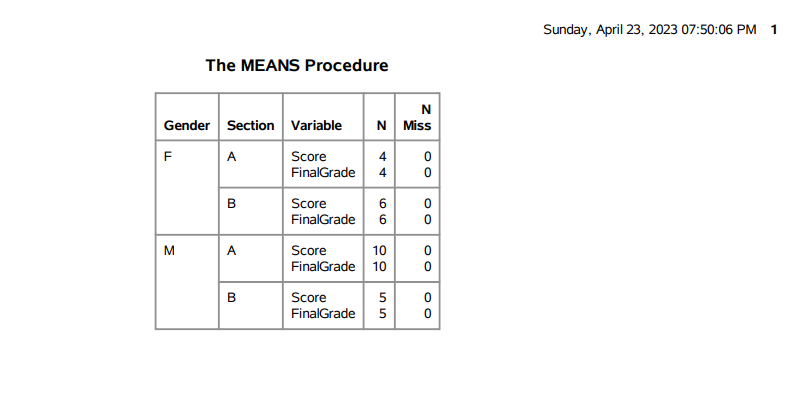
Printing the Results to an External PDF File
You can easily print the statistical results to an external file such as PDF or RTF using ODS (Output Delivery System).
				/* Print the Results to an External PDF File */

ODS PDF File='/home/u61950255/Files/Means_Result.PDF';
proc means data=grade n nmiss NOLABELS nonobs;
	class Gender Section;
	var Score FinalGrade;
run;
ODS PDF Close;
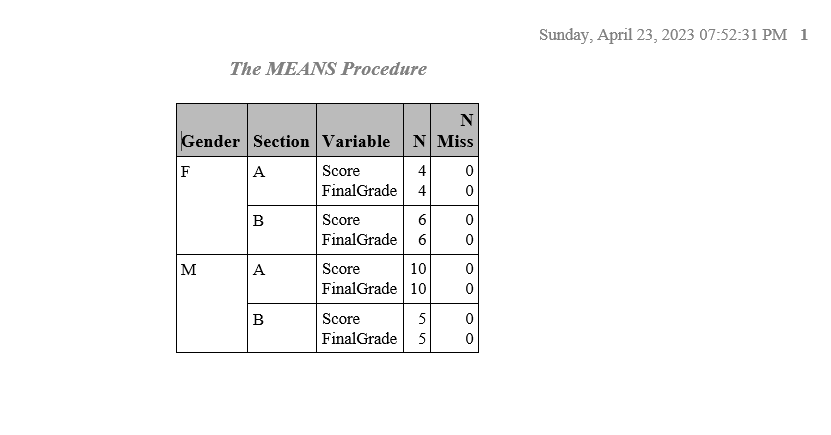
You can also export the results to a RTF file.
				/* Print the Results to an External RTF File */

ODS RTF File='/home/u61950255/Files/Means_Result.RTF';
proc means data=grade n nmiss NOLABELS nonobs;
	class Gender Section;
	var Score FinalGrade;
run;
ODS RTF Close;
PROC MEANS and PROC SUMMARY are very similar. You can read here more about PROC SUMMARY to see the exact differences.