PROC FREQ is an essential and most used procedure in SAS primarily for counting, displaying and analysing categorical type data. The PROC FREQ statement invokes the FREQ procedure in SAS.
The FREQ procedure produces one-way to N-way frequency and cross-tabulation tables. The statistics for contingency (cross-tabulation) tables include the following:
- chi-square tests and measures
- measures of association
- risks (binomial proportions) and risk differences for tables
- odds ratios and relative risks for tables
- tests for trend
- tests and measures of agreement
- Cochran-Mantel-Haenszel statistics
The FREQ procedure prints all values of a given categorical variable in the Output window, along with the counts and proportions. The FREQ procedure can work with both string (character) or numeric categorical variables.
With the PROC FREQ you can use ODS Graphics to create beautiful graphs as part of its output.
PROC FREQ Syntax:
				/* proc freq syntax */
PROC FREQ <options> ;
	TABLES requests </options OUT=SAS-data-set > ;
	BY variables ;
	WEIGHT variable </option> ;
	TEST options ;
	EXACT statistic-options </computation-options> ;
	OUTPUT <OUT=SAS-data-set> options ;
RUN;
Explanation:
TABLE or TABLES statement:
The TABLES statement requests one-way to n-way frequency and cross-tabulation tables and statistics for those tables.
If you omit the TABLES statement, PROC FREQ generates one-way frequency tables for all data set variables that are not listed in the other statements.
BY statement:
You can specify a BY statement with PROC FREQ to obtain separate analyses of observations in groups that are defined by the BY variables.
WEIGHT statement:
The WEIGHT statement names a numeric variable that provides a weight for each observation in the input data set. The WEIGHT statement is most commonly used to input cell count data.
OUTPUT statement:
The OUTPUT statement creates a SAS data set that contains statistics computed by PROC FREQ. You specify which statistics to store in the output data set with the OUTPUT statement options. The output data set contains one observation for each two-way table or stratum, and one observation for summary statistics across all strata.
OUT= <data-set-name>
Names an output data set that contains frequency or crosstabulation table counts and percentages.
The following sample dataset will be used to demonstrate different use cases of proc freq procedure in SAS.
/* create a new dataset with rank 1 to 100*/
data OnetoHundred (keep=rank);
do i=1 to 100;
rank=i;
output;
end;
run;
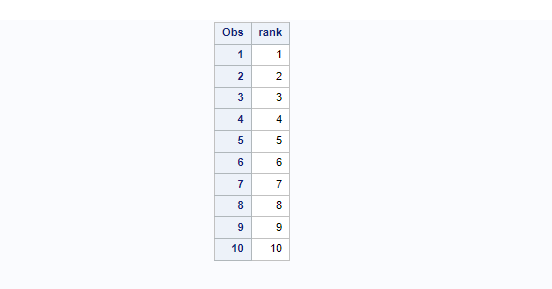
/* view dataset */
proc print data=OnetoHundred(obs=10); run;
A Simple Proc Freq Example
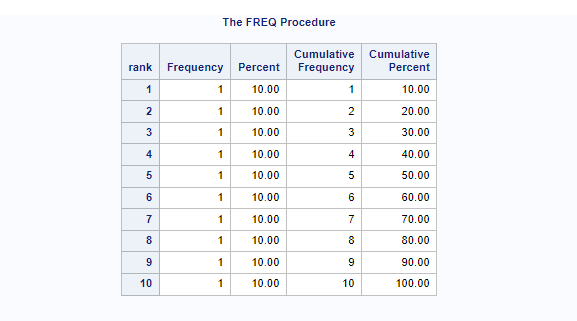
Let’s see a simple proc freq procedure applied on above created sample work.OnetoHundred dataset on the interest of variable Rank.
By default the proc freq computes the following statistics, frequency, percent, cumulative freq, cumulative percent, etc.
There would not be any output dataset created. The result will be printed in the RESULT tab in SAS studio. Also, note that we have only considered the first 10 records for now in this example.
				/* proc freq on Rank variable*/

proc freq data=OnetoHundred(obs=10);
   tables Rank ;
run;
Calculate Statistics For One Variable and Create Output Dataset
You can create an output dataset to store the result from proc freq procedure using OUT= option. You should also mention OUTCUM statement to include cumulative frequencies and cumulative percentages in the OUT= data set for one-way tables.
The following example calculates statistics for a Rank variable and creates an output dataset named work.freqRank. Here also we have only considered the first 10 observations from work.OnetoHundred dataset for simplicity.
				/*calculate statistics for Rank variable and create output dataset*/
proc freq data=OnetoHundred(obs=10);
   table Rank / out=freqRank outcum ;
run;

/*print output dataset*/
proc print data=freqRank;
	title 'view dataset: work.freqRank';
run;
PROC FREQ In SAS [ 20+ Examples ]
Now you have a basic understanding of how this procedure works, lets go a little bit more deeper and explore more advanced use cases of proc freq procedure with examples.
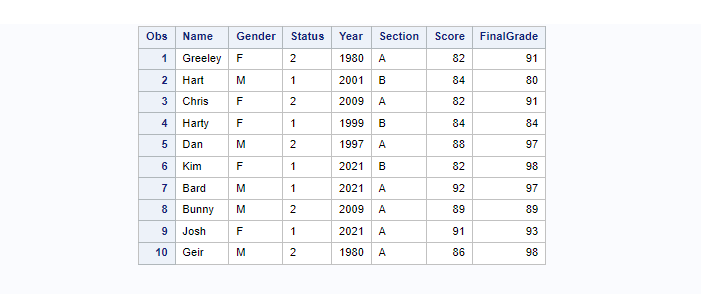
The following sample dataset work.grade will be created to show advanced examples of FREQ procedure in SAS.
				/* create a dataset */
data work.grade;
	input Name $ 1-8 Gender $ 11 Status $13 Year $ 15-18 Section $ 20 Score 22-23
		FinalGrade 25-26;
	label Name=Name Gender=Gender Status=Status Year=Year Section=Section
		Score=Score FinalGrade=FinalGrade;
	datalines;
Greeley   F 2 1980 A 82 91
Hart      M 1 2001 B 84 80
Chris     F 2 2009 A 82 91
Harty     F 1 1999 B 84 84
Dan       M 2 1997 A 88 97
Kim       F 1 2021 B 82 98
Bard      M 1 2021 A 92 97
Bunny     M 2 2009 A 89 89
Josh      F 1 2021 A 91 93
Geir      M 2 1980 A 86 98
;
run;

/* view dataset */
proc print data=grade; run;
Proc Freq With Single Variable On One Way Table
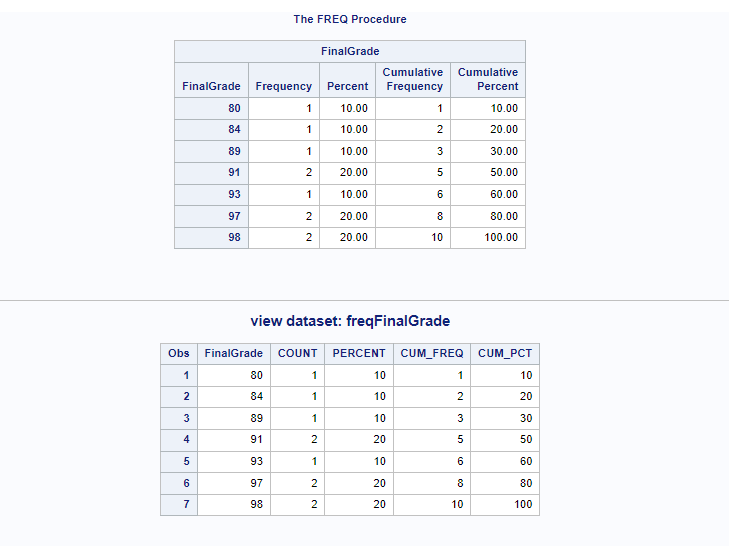
If you look at the above sample dataset, we have Name, Gender, Status, and other variables along with the FinalGrade variable.
In this example we will only consider one variable that is FinalGrade to calculate freq statistics. The out will be stored in the separate dataset named work.freqFinalGrade
The OUTCUM statement includes cumulative frequencies and cumulative percentages in the OUT= data set for one-way tables.
				/* proc freq on one variable */
proc freq data=grade;
   tables FinalGrade / out=freqFinalGrade outcum;
run;

/* view dataset */
proc print data=freqFinalGrade;
title 'view dataset: freqFinalGrade';
run;
Proc Freq With Multiple Variables
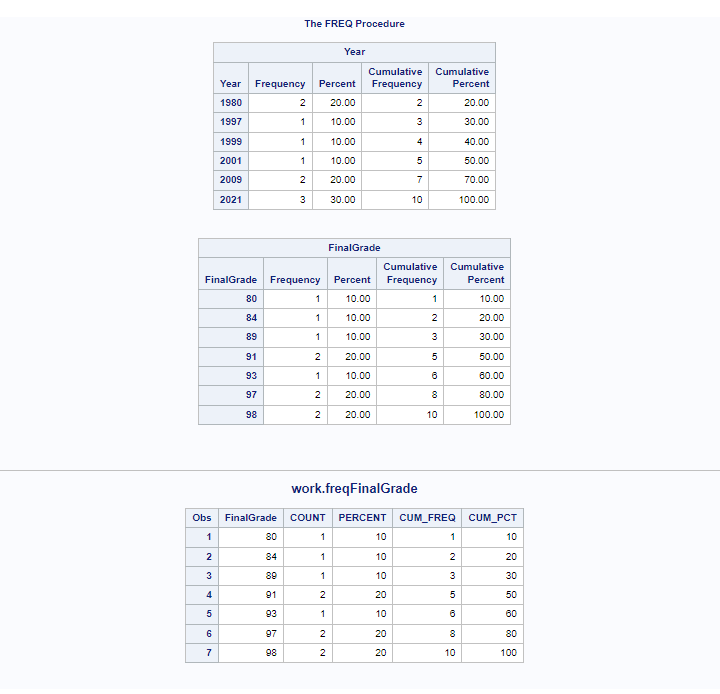
You can use the proc freq to compute freq statistics on multiple variables by listing them after the TABLES statement. In the below code we will try to generate freq statistics on variables Year and FinalGrade.
Important Note: The proc freq procedure will generate output for both the columns Year as well as FinalGrade. But when it comes to creating a new output dataset, SAS writes observations for the last variable mentioned in the TABLES.
In this case you’ll see the output dataset will be generated for the FinalGrade variable, not for the Year variable.
				/* proc freq with Multiple Variables */
proc freq data=grade;
   tables  Year FinalGrade / out=freqFinalGrade outcum;
run;

/* view dataset */
proc print data=freqFinalGrade;
	title 'work.freqFinalGrade';
run;
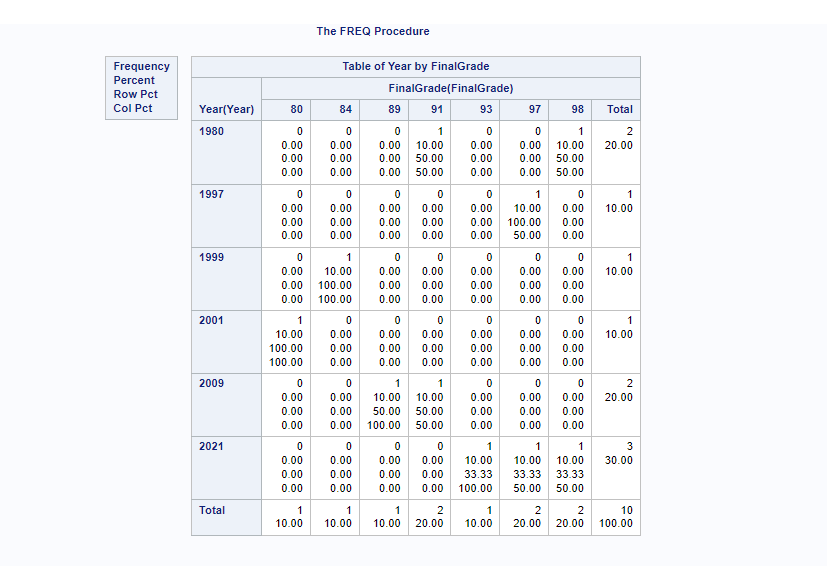
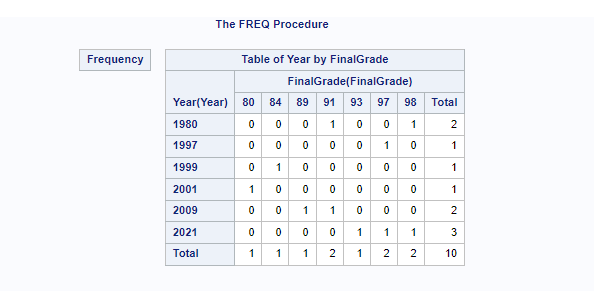
Proc Freq With Cross-Tabulation (2*2 Table)
You can use proc freq procedure to create frequency distribution of variable ‘Year’ by variable ‘FinalGrade’.
In FREQ procedure the asterisk (*) will be added between the variables mentioned after the TABLES statement. It becomes the cross-tabulation (2*2 table).
				/* Cross Tabulation ( 2*2 Table) */

/* distribution of variable 'Year' by variable 'FinalGrade' */
proc freq data=grade;
   tables Year*FinalGrade;
run;
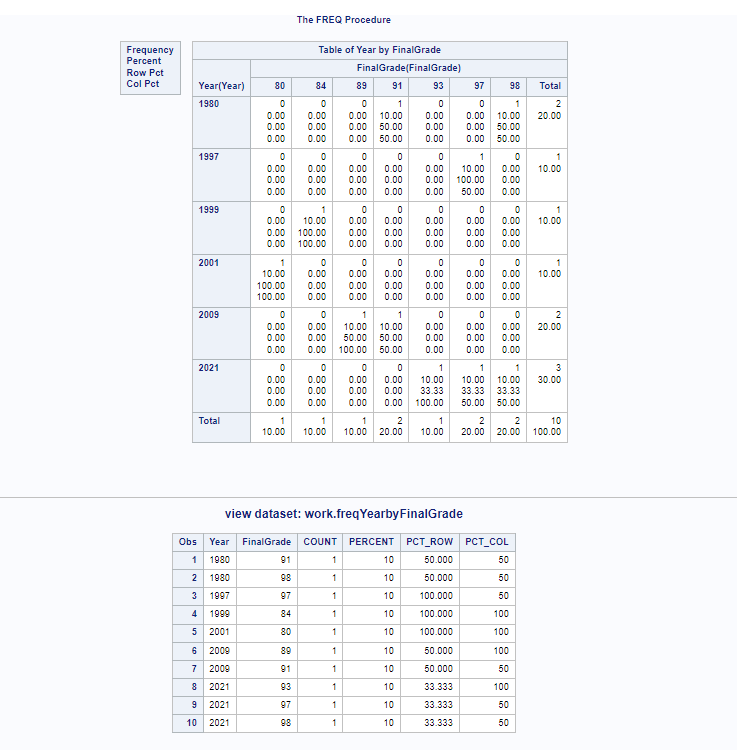
PROC FREQ: Cross-Tabulation (2*2 Table) With The OUT= Option
The proc freq in cross tabulation 2*2 table with output OUT= option you can create a new dataset that will have output of the proc freq procedure. If you observe carefully, the result generated by proc freq is little different from the data stored in the output dataset.
But the output dataset can be used further for analysis and reporting purposes. The OUTPCT statement can be used to include the following additional variables in the OUT= data set for crosstabulation tables:
- PCT_COL: percentage of column frequency
- PCT_ROW: percentage of row frequency
- PCT_TABL: percentage of stratum (two-way table) frequency
The following example shows how to create output dataset in proc freq cross tabulation 2*2 table.
				/* proc freq distribution of 'Year' by 'FinalGrade' */
proc freq data=grade;
   tables Year*FinalGrade / out=freqYearbyFinalGrade outpct ;
run;

/* view output dataset */
proc print data=freqYearbyFinalGrade;
	title 'view dataset: work.freqYearbyFinalGrade';
run;
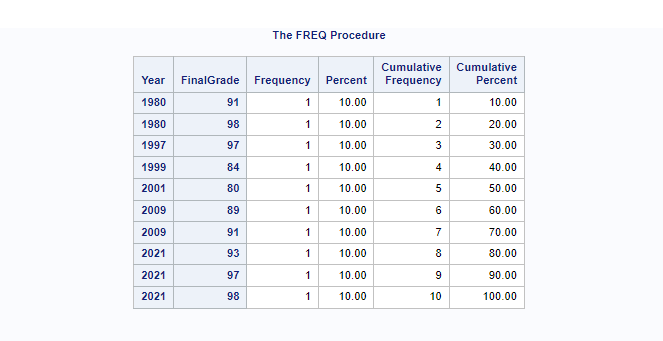
PROC FREQ: Cross-Tabulation With The LIST Form
The FREQ procedure displays two-way and multiway tables by using a list format instead of the default crosstabulation cell format. This option displays an entire multiway table in one table, instead of displaying a separate two-way table for each stratum.
The LIST form produces the quite similar output as it was produced in the previous example with the OUT= dataset option.
				/* proc freq: Cross Tabulation ( list form) */

proc freq data=grade;
   tables Year*FinalGrade / list ;
run;
PROC FREQ: Hide Unwanted Statistics Columns
Proc Freq creates freq distribution statistics such as Frequency, Percentage, Cumulative Frequency, Cumulative Percentage, ROW PCT, Column PCT, etc.
You can control what needs to be displayed with the options available in proc freq procedure such as norow, nocol, nopercent, etc.
Following example shows how to hide specific columns from the proc freq result.
				/* hide unwanted statistics columns */

proc freq data=grade;
   tables Year*FinalGrade  / norow nocol nopercent;
run;
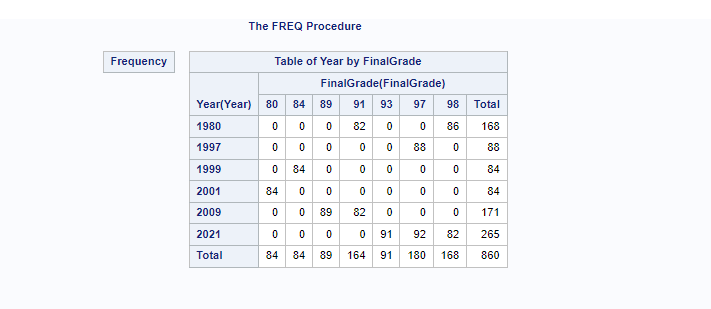
Use WEIGHT Statement In PROC FREQ Procedure
The WEIGHT statement names a numeric variable that provides a weight for each observation in the input data set. The WEIGHT statement is most commonly used to input cell count data.
The same above example has been used by adding a WEIGHT statement with numeric variable SCORE.
				/* Use WEIGHT Statement in proc freq */

proc freq data=grade;
   tables Year*FinalGrade  / norow nocol nopercent;
   weight Score;
run;
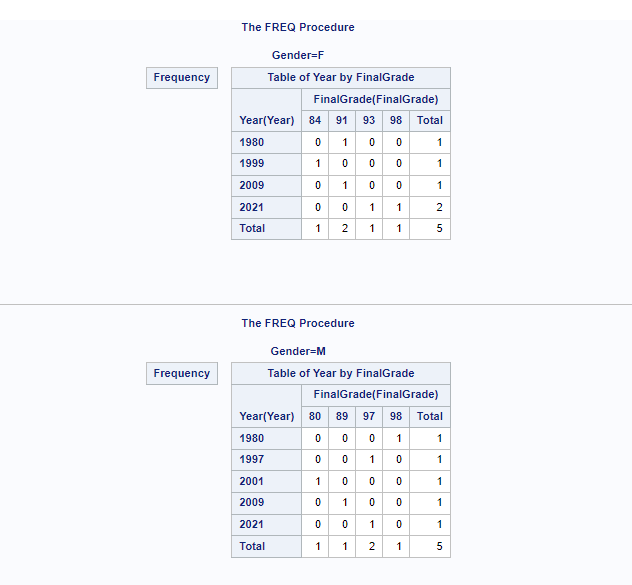
PROC FREQ Distribution Grouped by BY Variable
You can specify a BY statement in PROC FREQ to obtain separate analyses of observations in groups that are defined by the BY variables. When a BY statement appears, the procedure expects the input data set to be sorted in order of the BY variables. If you specify more than one BY statement, only the last one specified is used.
In this example we will create distribution statistics grouped by variable “Gender”. We know that input dataset work.grade is not sorted on Gender variable hence we need to first sort the data based on Gender.
				/* sort data on BY variable */
proc sort data=grade;
	by Gender;
run;

/* Proc freq with Grouped by BY Variable */
proc freq data=grade;
   tables Year*FinalGrade / norow nocol nopercent;
   by Gender;
run;
How To Add Where Clause In Proc Freq Procedure?
Proc Freq procedure can be applied on a subset of the input dataset by filtering out the data based on conditions using where clause. In the below example we are using the where clause “Gender=M” to perform frequency distribution statistics for Male by excluding female statistics.
				/* proc freq with where clause */
proc freq data=grade;
   where Gender = 'M';
   tables Year*FinalGrade / norow nocol nopercent;
   by Gender;
run;
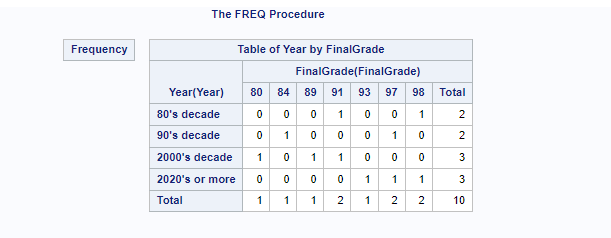
How To Use User Defined Format In PROC FREQ
With the PROC FREQ procedure you can specify which format to be used and accordingly it displays the output statistics. SAS inbuilt formats or user defined formats can be added to generate output the way you want to display it. A new output dataset can be created with the formatted values.
To demonstrate this let’s first create a user defined format for the YEAR variable present in the work.grade dataset. We will use the same variables, Year and FinalGrade in cross-tabulation (2*2 table) to generate frequency distribution statistics.
				/* Create user defined format  */
proc format;
value $YEAR
'1980'-'1989' = "80's decade"
'1990'-'1999' = "90's decade"
'2000'-'2009' = "2000's decade"
'2010'-'2019' = "2010's decade"
'2020'-'2099' = "2020's or more";
run;

/* Use user defined format in proc freq */
proc freq data=grade;
	format Year $YEAR.;
	tables Year*FinalGrade / norow nocol nopercent;
run;
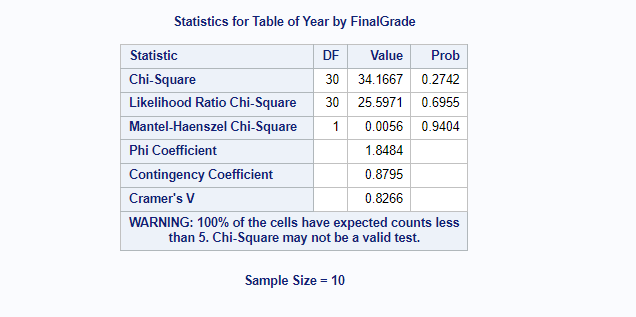
Run Chi-Square Analysis In Proc Freq Procedure
Requests chi-square tests of homogeneity or independence and measures of association that are based on the chi-square statistic.
For two-way tables, the chi-square tests include the Pearson chi-square, likelihood ratio chi-square, and Mantel-Haenszel chi-square tests. The chi-square measures include the phi coefficient, contingency coefficient, and Cramér’s V.
You can specify the following chisq-options in parentheses after the CHISQ option:
- DF=df : it specifies the degrees of freedom for the chi-square tests. The value of df must not be zero.
- LRCHI : requests the likelihood ratio goodness-of-fit test for one-way tables.
- TESTF=(values) | SAS-data-set : specifies null hypothesis frequencies for the one-way chi-square goodness-of-fit tests.
- TESTP=(values) | SAS-data-set : specifies null hypothesis proportions for the one-way chi-square goodness-of-fit tests.
- WARN=value | (values) : controls the warning message for the validity of the asymptotic Pearson chi-square test.
By default, PROC FREQ displays a warning message when more than 20% of the table cells have expected frequencies that are less than 5.
				/* Run Chi-Square Analysis */

proc freq data=grade;
   tables Year*FinalGrade / chisq;
run;
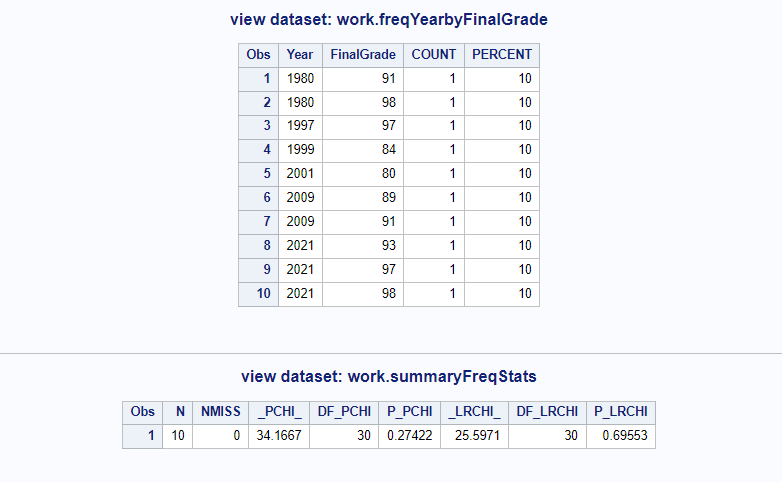
Summary Statistics In Proc Freq Using OUTPUT statement
As stated earlier in the article explaining the syntax of proc freq, the OUTPUT statement creates a SAS data set that contains statistics computed by PROC FREQ.
You specify which statistics to store in the output data set with the OUTPUT statement options. The output data set contains one observation for each two-way table or stratum, and one observation for summary statistics across all strata.
The following code shows how you can create summary statistics on Chi-Square analysis and store the output in the new data set work.summaryFreqStats
				/* Generate summary statistics using OUTPUT statement*/
proc freq data=grade;
   tables Year*FinalGrade / chisq out=freqYearbyFinalGrade;
   output out=summaryFreqStats n nmiss pchi lrchi;
run;

/* view output datasets */
proc print data=freqYearbyFinalGrade;
	title 'view dataset: work.freqYearbyFinalGrade';
run;
proc print data=summaryFreqStats;
	title 'view dataset: work.summaryFreqStats';
run;
ODS Graphics In PROC FREQ
Statistical procedures use ODS Graphics to create graphs as part of their output. Before you create graphs, ODS Graphics must be enabled using the ODS GRAPHICS ON statement at the beginning of the code.
The PLOT=option statement can be used to tell SAS what graphs to plot with proc freq procedure.It controls the plots that are produced through ODS Graphics.
The most used plot-requests in PLOTS=option together with their required TABLES statement options.
AGREEPLOT : Agreement plot.
– TABLES statement option: AGREE ( table)
ALL : All plots
– TABLES statement option: None
CUMFREQPLOT : Cumulative frequency plot
– TABLES statement option: One-way table request
DEVIATIONPLOT : Deviation plot
– TABLES statement option: CHISQ (one-way table)
FREQPLOT : Frequency plot
– TABLES statement option: Any table request
KAPPAPLOT : Kappa plot
– TABLES statement option: AGREE ( table)
MOSAICPLOT : Mosaic plot
– TABLES statement option: Two-way or multiway table request
NONE : No plots
– TABLES statement option: None
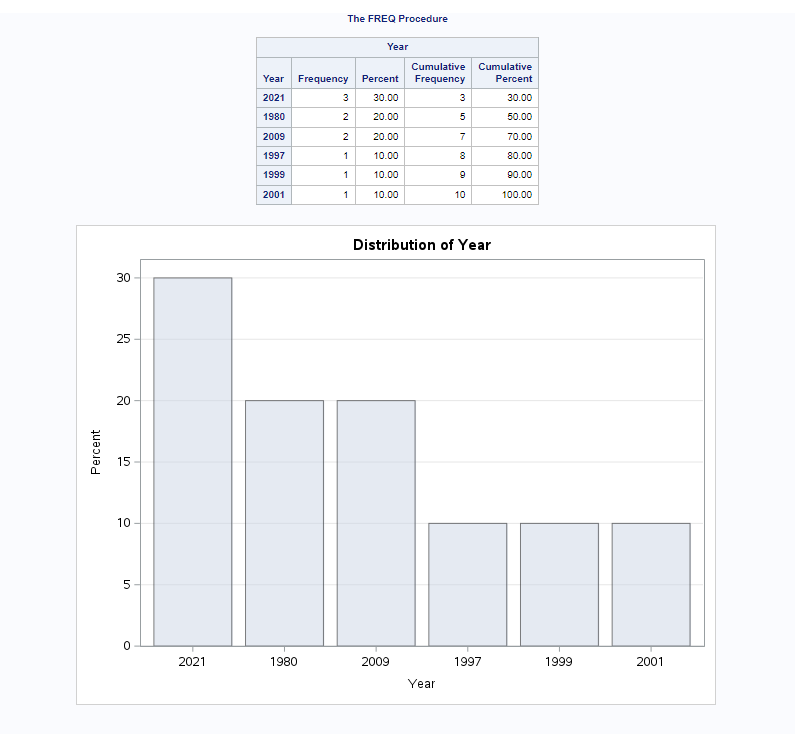
How To Generate BAR Chart Using Proc Freq Procedure?
You can plot the bar chart using the output data generated by the proc freq procedure. As explained earlier you can use plots=option in the proc freq procedure itself by mentioning type=bar and scale=percent.
In the below example we will create a frequency plot bar chart on the Year variable.
				/* Generate Bar Chart in proc freq */

ods graphics on;
proc freq data=grade order=freq;
	tables Year / plots=freqplot (type=bar scale=percent);
run;
ods graphics off;
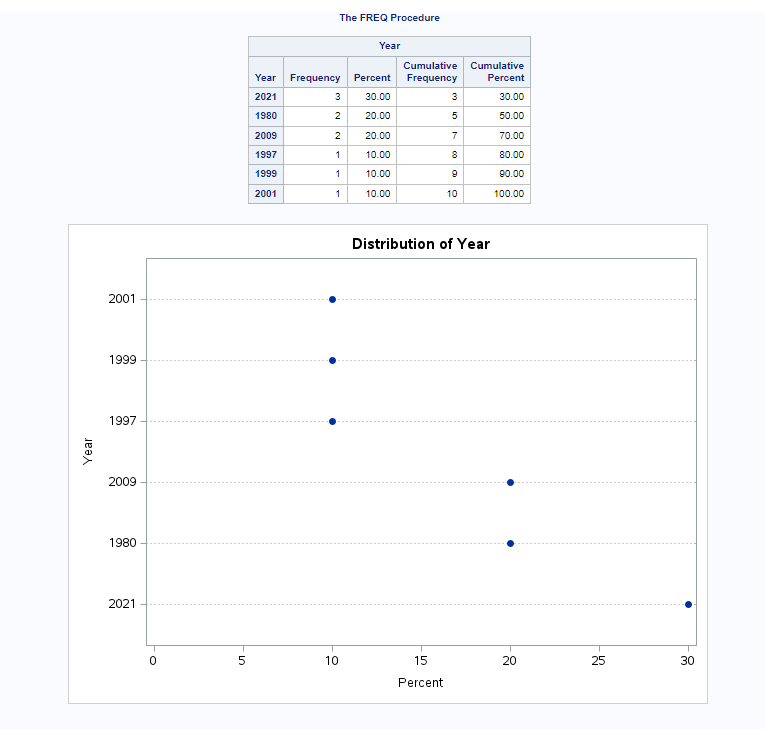
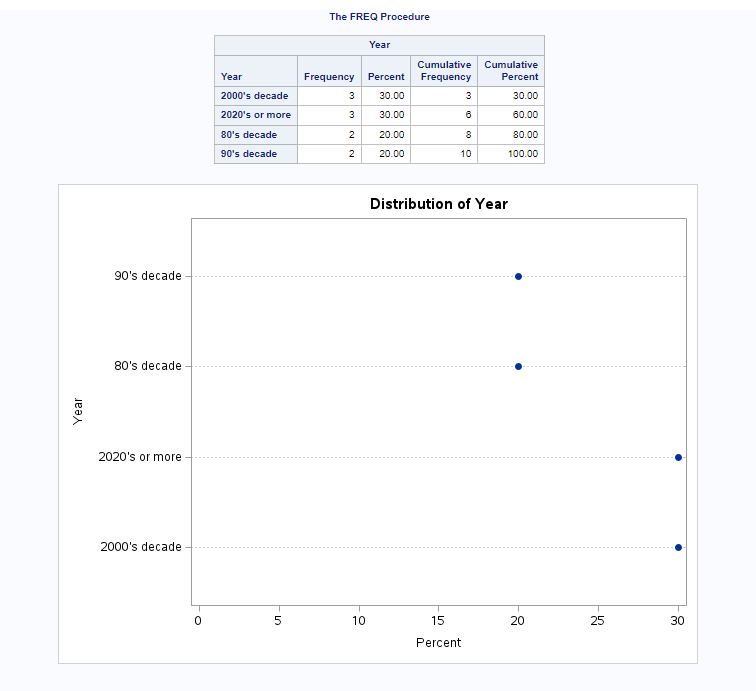
How To Generate DOT Plot Chart Using Proc Freq?
You can create the dot plot chart using the output data generated by the proc freq procedure. As explained earlier you can use plots=option in the proc freq procedure itself by mentioning type=dot and scale=percent.
In the below example we will create a frequency plot dot chart on the Year variable.
				/* Generate Dot Plot in proc freq*/

ods graphics on;
proc freq data=grade order=freq;
	tables Year/ plots=freqplot (type=dot scale=percent);
run;
ods graphics off;
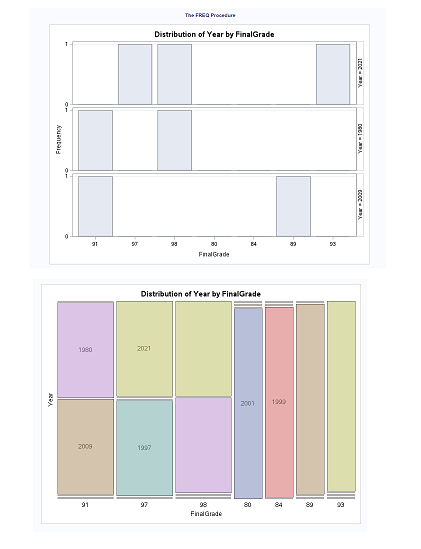
How To Generate ALL Plots in Proc Freq?
You can generate all plots using plots=all option in proc freq with ODS graphics statement. To demonstrate how this work we have generated statistics for Year by FinalGrade in 2*2 table.
				/* Generate ALL plots */

ods graphics on;
proc freq data=grade order=freq;
	tables Year*FinalGrade / plots=all;
run;
ods graphics off;
How To Generate Graphs In Proc Freq With User Defined Format?
You’ll find tons of examples on how to create user defined formats in SAS. In fact one of our previous examples in the article has explained how to create a format for the YEAR variable.
Let’s create the same format again and apply it here to generate graphs (dot plot) in the proc freq procedure.
				/* Create user defined format  */
proc format;
value $YEAR
'1980'-'1989' = "80's decade"
'1990'-'1999' = "90's decade"
'2000'-'2009' = "2000's decade"
'2010'-'2019' = "2010's decade"
'2020'-'2099' = "2020's or more";
run;

/* create dot plot */
ods graphics on;
proc freq data=grade order=formatted;
	format Year $YEAR.;
	tables Year/ plots=freqplot (type=dot scale=percent);
run;
ods graphics off;
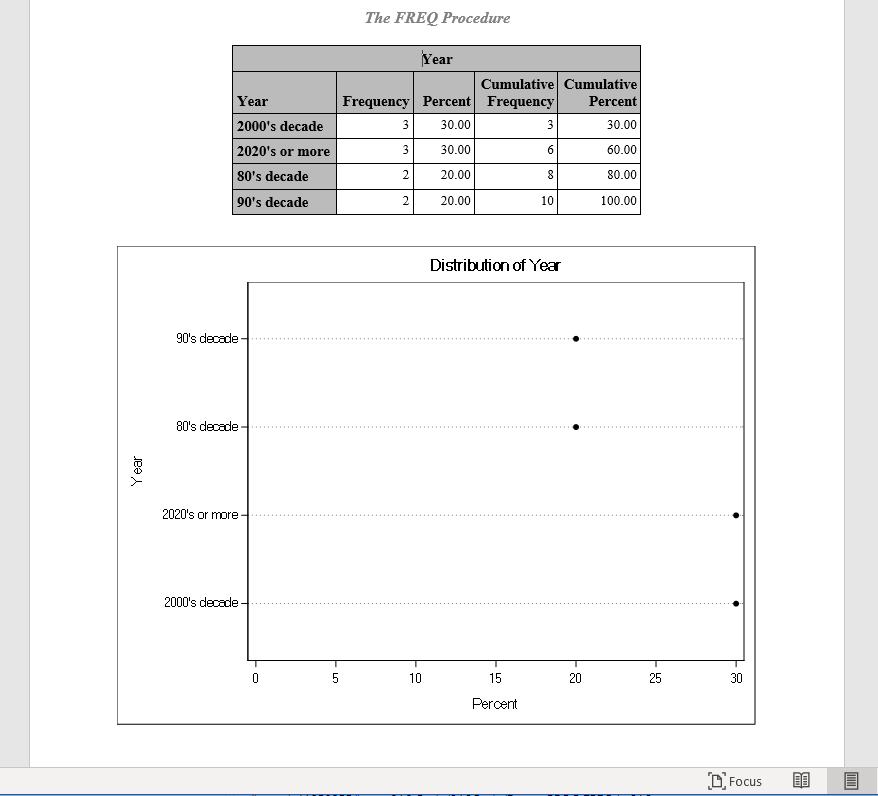
How To Create RTF Doc With Proc Freq Output
You can print the proc freq result to a RTF (Rich Text Format) file in SAS. ODS statement can be used in SAS to create this document. ODS statements help generate high-quality, detailed presentation output from SAS. With ODS, you can create various file types including HTML, Rich Text Format (RTF), PostScript (PS), Portable Document Format (PDF), and SAS data sets.
You need to add an ODS RTF statement in the beginning of your code by specifying output file details and add an ODS RTF close statement at the end.
We will use the same previous example and put the result into an RTF file using the ODS RTF statement.
				/* Print the Results to an External RTF File */

ODS RTF File='/home/u61950255/Files/Freq_Result.RTF';
ods graphics on;
proc freq data=grade order=formatted;
	format Year $YEAR.;
	tables Year/ plots=freqplot (type=dot scale=percent);
run;
ods graphics off;
ODS RTF Close;
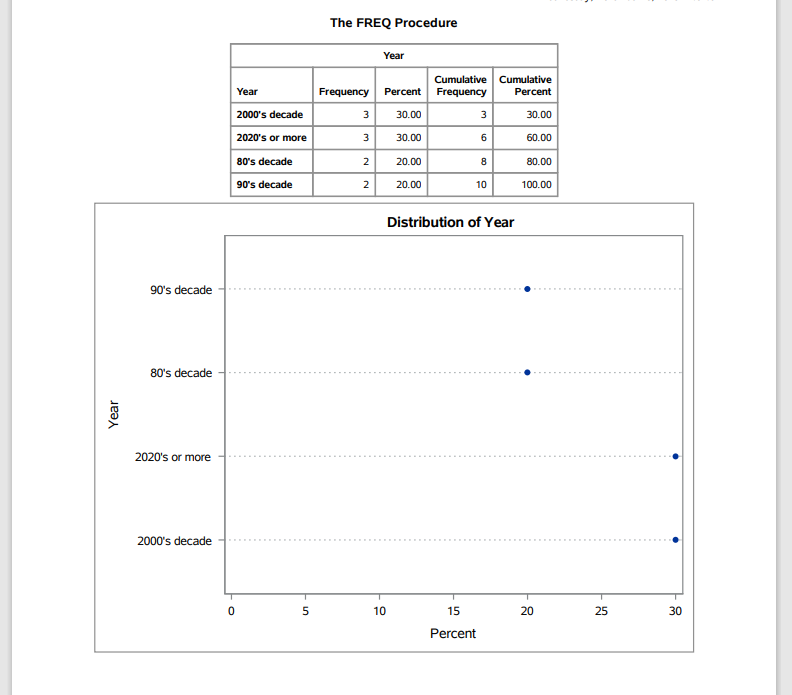
How To Create PDF File With Proc Freq Output?
You can print the proc freq result to a PDF file in SAS similar to an PDF file. ODS statement can be used in SAS. You need to add an ODS PDF statement in the beginning of your code by specifying output file details and add an ODS PDF close statement at the end.
We will use the same example which we have used to create an RTF file to create PDF file output using the ODS PDF statement.
				/* Print the Results to an External PDF File */

ODS PDF File='/home/u61950255/Files/Freq_Result.PDF';
ods graphics on;
proc freq data=grade order=formatted;
	format Year $YEAR.;
	tables Year/ plots=freqplot (type=dot scale=percent);
run;
ods graphics off;
ODS PDF Close;
FAQ – PROC FREQ In SAS
To create a crosstabulation table for two variables, you need to specify the names of the two variables separated by an asterisk (*) in the TABLES statement.
Proc freq is a SAS procedure that performs frequency analysis on one or more categorical variables. It can produce frequency tables, crosstabulation tables, bar charts, and tests for association between variables.
To create a bar chart for a variable, you need to add the PLOTS= option to the PROC FREQ statement and specify the type of plot you want. For bar chart type=bar can be used in proc freq.
To suppress or display certain statistics in the tables, you need to add the slash (/) option to the TABLES statement and specify the options you want.
Some of the common options you can use are:
- NOCUM: suppresses the cumulative frequency and percentage
- NOPERCENT: suppresses the percentage
- NOROW: suppresses the row percentage in the crosstabulation table
- NOCOL: suppresses the column percentage in the crosstabulation table
- LIST: displays the table in a list format instead of a tabular format
- ALPHA: orders the levels of the variables alphabetically
- FREQ: orders the levels of the variables by frequency
- MISSING: includes the missing values in the analysis