The PROC SUMMARY procedure is used to explore and analyse data not only in terms of count and distribution but also statistically. The SUMMARY and PROC MEANS are quite a similar SAS procedures with two minor differences.
The first difference is, PROC MEANS prints a report by default, whereas PROC SUMMARY does not. And the second one is, PROC SUMMARY requires the OUTPUT statement, whereas MEANS does not.
PROC SUMMARY computes many useful statistics such as mean, sum, standard deviation, N, Median, min, max, and so on.
PROC SUMMARY can be used in SAS Cloud Analytic Services (CAS). Running PROC SUMMARY with CAS actions has several advantages over processing within SAS.
In this article we will be using SAS Studio and BASE SAS to explain more about proc summary procedure in SAS.
PROC SUMMARY Syntax:
				/* proc summary syntax */

PROC SUMMARY <options> <statistic-keyword(s)>;
	BY variable-1 variable-2 ...;
	CLASS variable(s) </ options>;
	FREQ variable;
	ID variable(s);
	OUTPUT <OUT=SAS-data-set> </ options> ;
	TYPES request(s);
	VAR variable(s);
	WAYS list;
	WEIGHT variable;
run;
Explanation:
- PROC SUMMARY:
Compute descriptive statistics for variables across all observations or within groups of observations - BY:
Calculate separate statistics for each BY group - CLASS
Identify variables whose values define subgroups for the analysis - FREQ
Identify a variable whose values represent the frequency of each observation - ID
Include additional identification variables in the output data set - OUTPUT
Create an output data set that contains specified statistics and identification variables - TYPES
Identify specific combinations of class variables to use to subdivide the data - VAR
Identify the analysis variables and their order in the results - WAYS
Specify the number of ways to make unique combinations of class variables - WEIGHT
Identify a variable whose values weight each observation in the statistical calculations
The following sample dataset will be used to demonstrate different examples of using proc summary procedure in sas.
				/* create a new dataset with rank 1 to 100*/
data OnetoHundred (keep=rank);
	do i=1 to 100;
		rank=i;
		output;
	end;
run;

/* view dataset */
proc print data=OnetoHundred; run;
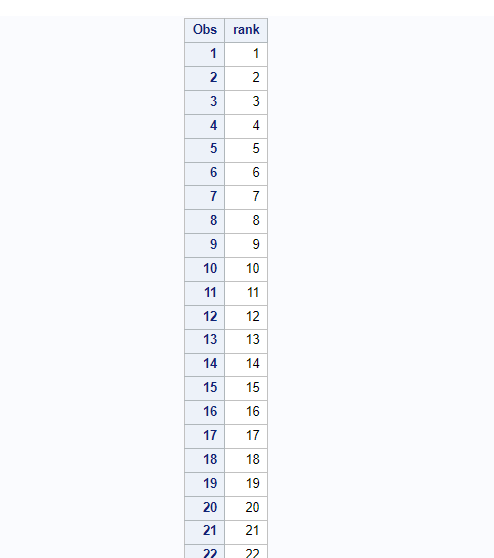
A Simple Proc Summary Example
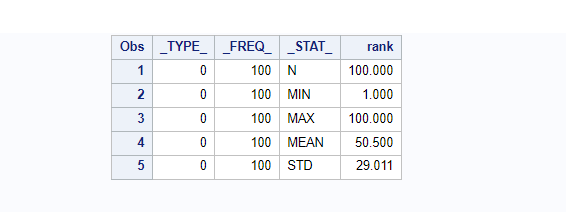
Let’s see a simple proc summary procedure applied on previously created sample work.OnetoHundred dataset on the interest of variable rank. Also, I have mentioned out= statement to create an output dataset named “summaryRank” which will hold the result of this procedure.
By default the proc summary computes the following statistics, N, MIN, MAX, MEANS, STD.
				/*calculate descriptive statistics for Rank variable*/
proc summary data=OnetoHundred;
   var Rank;
   output out=summaryRank;
run;

/*print output dataset*/
proc print data=summaryRank;
PROC SUMMARY In SAS Examples
Now you have a basic understanding of how this procedure works, let go a little bit more deeper and explore more advanced use cases of proc summary procedure with examples.
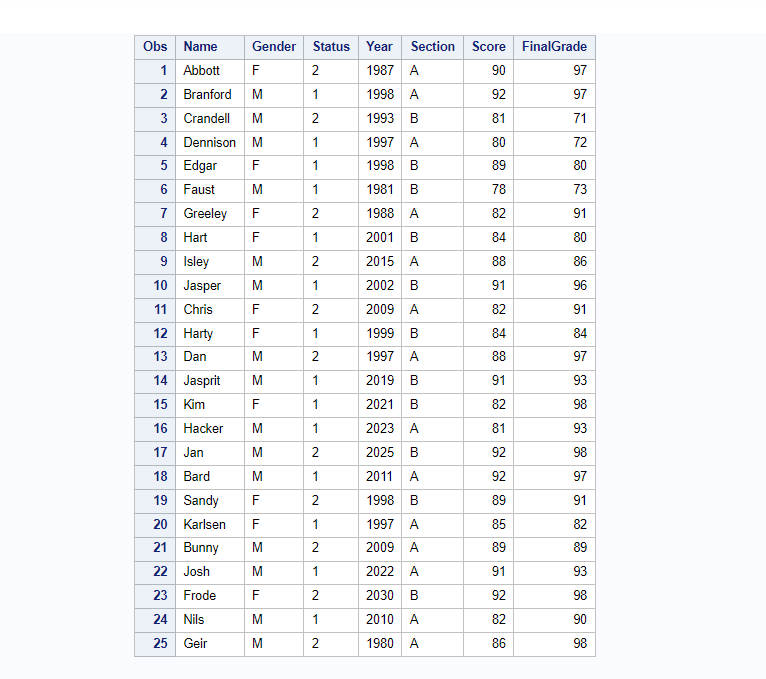
The following sample dataset work.grade will be created to show advanced examples of summary procedure.
				/* create a dataset */
data work.grade;
	input Name $ 1-8 Gender $ 11 Status $13 Year $ 15-18 Section $ 20 Score 22-23
		FinalGrade 25-26;
	label Name=Name Gender=Gender Status=Status Year=Year Section=Section
		Score=Score FinalGrade=FinalGrade;
	datalines;
Abbott    F 2 1987 A 90 97
Branford  M 1 1998 A 92 97
Crandell  M 2 1993 B 81 71
Dennison  M 1 1997 A 80 72
Edgar     F 1 1998 B 89 80
Faust     M 1 1981 B 78 73
Greeley   F 2 1988 A 82 91
Hart      F 1 2001 B 84 80
Isley     M 2 2015 A 88 86
Jasper    M 1 2002 B 91 96
Chris     F 2 2009 A 82 91
Harty     F 1 1999 B 84 84
Dan       M 2 1997 A 88 97
Jasprit   M 1 2019 B 91 93
Kim       F 1 2021 B 82 98
Hacker    M 1 2023 A 81 93
Jan       M 2 2025 B 92 98
Bard      M 1 2011 A 92 97
Sandy     F 2 1998 B 89 91
Karlsen   F 1 1997 A 85 82
Bunny     M 2 2009 A 89 89
Josh      M 1 2022 A 91 93
Frode     F 2 2030 B 92 98
Nils      M 1 2010 A 82 90
Geir      M 2 1980 A 86 98
;
run;

/* view dataset */
proc print data=grade; run;
Proc Summary With Single Variable
If you look at the above sample dataset, we have Name, Gender, Status, and other variables along with FinalGrade.
In this example we will only consider one variable that is FinalGrade to calculate statistics. Output will be stored in the separate dataset named work.summaryFinalGrade
				/* proc summary on one variable */
proc summary data=grade;
   var FinalGrade;
   output out=summaryFinalGrade;
run;

/*view output dataset */
proc print data=summaryFinalGrade; run;

Choose Statistics To Calculate
You can explicitly tell SAS what are the statistics you want in the output dataset. When you specify any specific statistics to calculate, the output dataset gets transposed and displays data in a more readable and meaningful way.
The below code is exactly similar to the previous one except this time we have mentioned what statistics to calculate. You can observe the output dataset and see how the dataset gets transposed.
				/* choose statistics to calculate */
proc summary data=grade;
   var FinalGrade;
   output out=summaryFinalGrade mean=mean sum=sum;
run;

/*view output dataset */
proc print data=summaryFinalGrade; run;

Proc Summary With Multiple Variables
You can use the proc summary to compute statistics on multiple variables by listing them after the VAR keyword.
In the below code we will try to generate summary statistics on variables Score and FinalGrade. Output of the procedure will be stored in the output dataset work.summaryScoreFinalGrade.
				/* Proc Summary with Multiple Variables */
proc summary data=grade;
   var Score FinalGrade;
   output out=summaryScoreFinalGrade;
run;

/*view output dataset */
proc print data=summaryScoreFinalGrade; run;

Proc Summary With Group By Another Variables
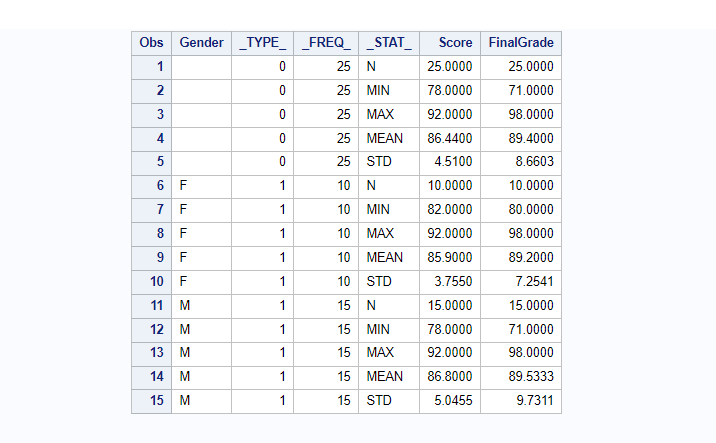
In the previous example we have demonstrated how to use proc summary on multiple variables. Let’s go one step further and calculate group statistics by using the CLASS keyword. It works similar to group by statement in proc sql.
In the below code we will calculate statistics for Score and FinalGrade, grouped by Gender and result data will be stored in the new dataset named work.summaryScoreFinalGradebyGender.
				/* Proc Summary with Grouped by Another Variable */
proc summary data=grade;
   class Gender;
   var Score FinalGrade;
   output out=summaryScoreFinalGradebyGender;
run;

proc print data=summaryScoreFinalGradebyGender;
Proc Summary On Filtered Data
You can use WHERE clause to filter out data in the proc summary procedure. The statistics will be generated on a subset of data based on where condition.
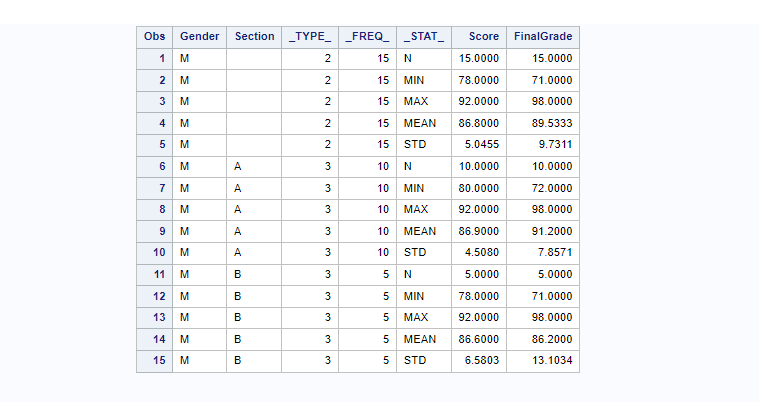
In the following example data will be grouped by two variables, Gender and Section to calculate statistics for two variables, Score and FinalGrade. The out data will be stored in the new dataset work.smryScoreFinalGradebyGenderSec.
				/* Proc Summary with where clause */
proc summary data=grade;
   where Gender = 'M' ;
   class Gender Section;
   var Score FinalGrade;
   output out=smryScoreFinalGradebyGenderSec (where=(Gender ne '') );
run;

proc print data=smryScoreFinalGradebyGenderSec;
How To Remove or Keep Variables in PROC SUMMARY?
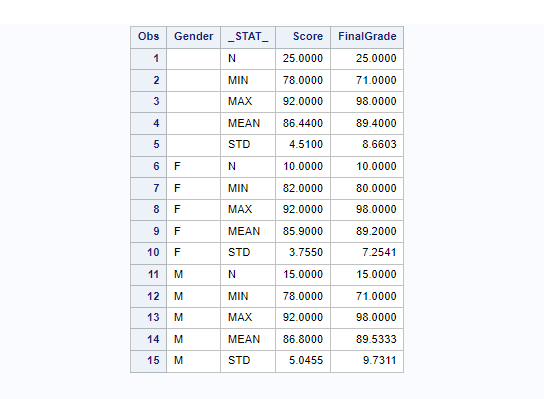
You can use drop= or keep= options to remove or keep variables from the output dataset of proc summary. You could do this within the proc summary procedure.
The following example shows how to remove _type_ and _freq_ variables from the output dataset.
				/* Drop or keep _type_ and _freq_ columns */
proc summary data=grade ;
	class Gender;
	var Score FinalGrade;
	output out=grade_proc_summary(drop = _type_ _freq_);
run;

proc print data=grade_proc_summary; run;
How To Give Custom Names to Variables In Proc Summary?
It’s also possible to change variable names and give custom names to variables in the output dataset. Here we’ve mentioned two variables to calculate statistics grouped by Gender, hence we will give the custom names to calculated variable names for both the variables, Score and FinalGrade.
Custom names for statistical columns:
- Score: CustScore_mean, CustScore_median, CustScore_std
- FinalGrade: CustFinalGrade_mean, CustFinalGrade_median, CustFinalGrade_std
				/* You can give custom names to variables
stored in the output data set. */

proc summary data=grade ;
	class Gender;
	var Score FinalGrade;
	output out=grade_proc_summary(drop = _type_ _freq_ where=(Gender ne '') )
	mean  = CustScore_mean CustFinalGrade_mean
	median= CustScore_median CustFinalGrade_median
	std   = CustScore_std CustFinalGrade_std
;
run;

/* view output dataset */
proc print data=grade_proc_summary; run;

How To Create PDF file with Proc Summary Output
You can print the proc summary result to a PDF file in SAS. ODS option can be used in SAS. ODS opens a whole new world of choices in generating high-quality, detailed presentation output from SAS. With ODS, you can create various file types including HTML, Rich Text Format (RTF), PostScript (PS), Portable Document Format (PDF), and SAS data sets.
You need to add an ODS PDF statement in the beginning of your code by specifying output file details and add an ODS PDF close statement at the end.
				/* Print the proc summary result to an External PDF File */

ODS PDF File='/home/u61950255/Files/Summary_Result.PDF';
options nodate nonumber;
proc summary data=grade;
	class Gender;
	var Score FinalGrade;
	output out=grade_proc_summary(drop = _type_ _freq_ where=(Gender ne '') )
	mean  = CustScore_mean CustFinalGrade_mean
	median= CustScore_median CustFinalGrade_median
	std   = CustScore_std CustFinalGrade_std
;
run;
proc print data=grade_proc_summary;
	title 'Demo: Print the proc summary result to an External PDF File';
run;
ODS PDF Close;

How To Create RTF document with Proc Summary Output
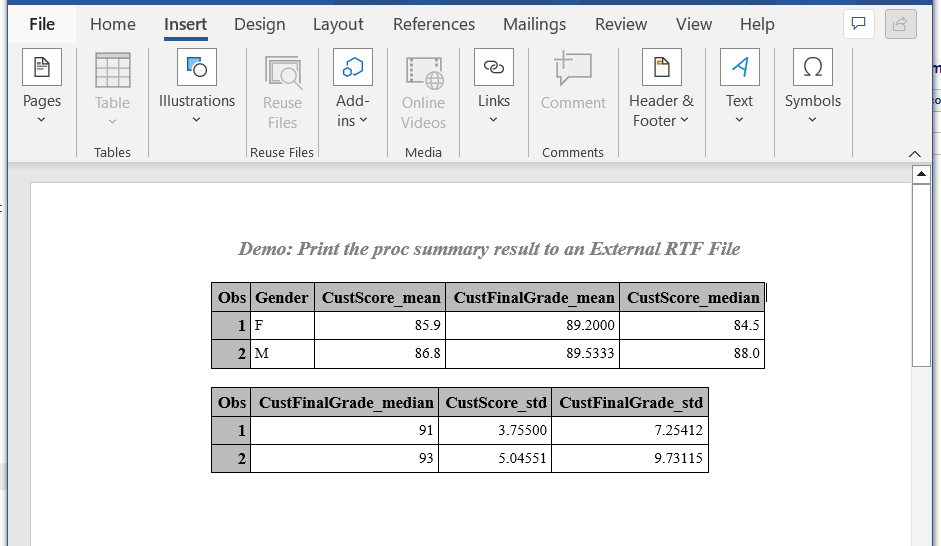
You can print the proc summary result to a RTF (Rich Text Format) file in SAS. ODS option can be used in SAS to create this document. ODS statements help generate high-quality, detailed presentation output from SAS. With ODS, you can create various file types including HTML, Rich Text Format (RTF), PostScript (PS), Portable Document Format (PDF), and SAS data sets.
You need to add an ODS RTF statement in the beginning of your code by specifying output file details and add an ODS RTF close statement at the end.
				/* Print the proc summary results to an External RTF File */

ODS RTF File='/home/u61950255/Files/Summary_Result.RTF';
options nodate nonumber;
proc summary data=grade;
	class Gender;
	var Score FinalGrade;
	output out=grade_proc_summary(drop = _type_ _freq_ where=(Gender ne '') )
	mean  = CustScore_mean CustFinalGrade_mean
	median= CustScore_median CustFinalGrade_median
	std   = CustScore_std CustFinalGrade_std
;
run;
proc print data=grade_proc_summary;
	title 'Demo: Print the proc summary result to an External RTF File';
run;
ODS RTF Close;
FAQ
Proc summary is a powerful SAS procedure that can be used to calculate descriptive statistics for variables either across all observations or within specific groups of observations. proc summary is quite similar to proc means procedure in SAS.
Proc summary and proc means are very similar in SAS, but there are some differences. The main difference is that proc summary can output statistics to a data set, while proc means can only prints results into output window or prints into an external file.
To use proc summary in SAS, you need to specify the input data set with the data= option, the analysis variables with the var statement, and the output data set with the output statement. You can also use other statements and options to customize the analysis.