PROC REPORT statement combines features of the PROC PRINT, PROC MEANS, and PROC TABULATE procedures with features of the DATA step in a single report-writing tool that can produce a variety of reports.
You can use PROC REPORT procedure to create a report with the SAS dataset and in the formats you would like to see in the report.
What Does The PROC REPORT Procedure Do?
- Tabular Reporting: PROC REPORT enables you to create tabular reports that organise data in the rows and columns.
- Grouping and Breaks: You can group data based on one or more variables and create break lines that visually separate the groups. This helps in organizing and summarizing data by different categories.
- Summary Statistics: You can calculate summary statistics such as sums, means, counts, minimums, maximums, and more for specific variables or groups using PROC REPORT.
- Calculated Columns: PROC REPORT allows you to create new columns in the report that are calculated based on expressions or computations involving existing variables.
- Conditional Formatting: PROC REPORT supports conditional formatting, allowing you to highlight specific cells, rows, or columns based on certain conditions.
- Customization and Formatting: PROC REPORT provides a wide range of options for customizing the appearance and layout of your report. You can control fonts, colours, borders, spacing, alignment, and other formatting aspects to create visually appealing reports.
Basic syntax:
				/* proc report syntax */

PROC REPORT data=SAS-data-set options;
	COLUMNS variable_1 - variable_n;
	DEFINE variable_1 / options;
	DEFINE variable_2 / options;
	DEFINE variable_n / options;
	COMPUTE blocks;
		ENDCOMPUTE;
	BREAK;
	RBREAK;
RUN;
Explanation:
- DATA= Specify the input data set to be used for processing.
- HEADLINE Create a horizontal line between the column headers and the body of the report.
- HEADSKIP Create a blank line between the column headers and the body of the report.
- NOWINDOWS Suppress the REPORT window and direct the report output to open ODS destinations.
- OUT= Create an output SAS data set.
- OUTREPT= Specify a location to store the report.
- PROMPT Activate prompting mode by using a built-in wizard.
- REPORT= Specify a stored report to be used in generating a new report.
A Simple PROC REPORT Example
You can simply use the proc report procedure without defining anything or adding any features or options to print the dataset in the output. It works exactly similar to the proc print procedure.
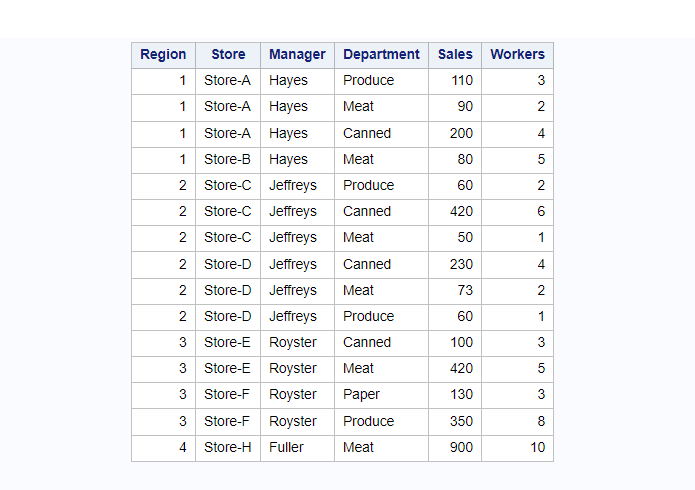
The following sample dataset will be used to demonstrate the different use cases and examples of using PROC REPORT in SAS.
				/* Create sample dataset */
data Sales_ds;
	input Region Store $ Manager $ Department $ Sales 8. Workers 8.;
	datalines;
1    Store-A    Hayes       Produce    110      3
1    Store-A    Hayes       Meat       90       2
1    Store-A    Hayes       Canned     200      4
1    Store-B    Hayes       Meat       80       5
2    Store-C    Jeffreys    Produce    60       2
2    Store-C    Jeffreys    Canned     420		6
2    Store-C    Jeffreys    Meat       50		1
2    Store-D    Jeffreys    Canned     230		4
2    Store-D    Jeffreys    Meat       73		2
2    Store-D    Jeffreys    Produce    60       1
3    Store-E    Royster     Canned     100		3
3    Store-E    Royster     Meat      420      5
3    Store-F    Royster     Paper      130		3
3    Store-F    Royster     Produce    350		8
4    Store-H    Fuller      Meat      900		10
;
run;
The PROC REPORT procedure without any other statement just prints the dataset. The below code produces the same results as if you execute the PROC PRINT procedure.
				/* A simple proc report example */

proc report data=Sales_ds;
run;
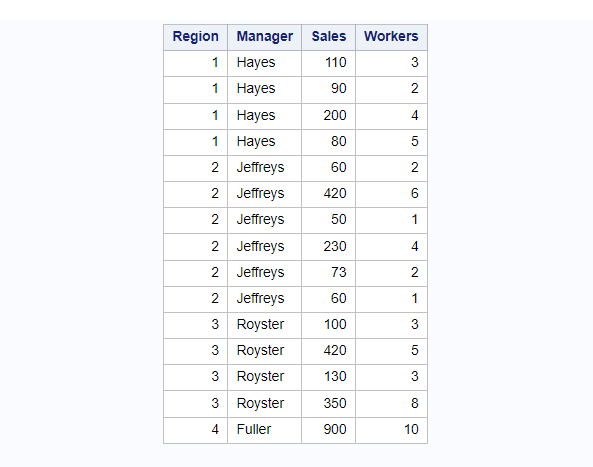
PROC REPORT With Column Selection
By default the proc report procedure considers all the columns and prints it in the output report. But you can also choose variables that appear in the output report by using a COLUMN statement followed by a list of variables that needs to be added in the report.
This example selects only four variables: region, manager, Sales, and Workers.
				/* proc report with selected columns */

proc report data=Sales_ds;
	column region manager Sales Workers;
run;
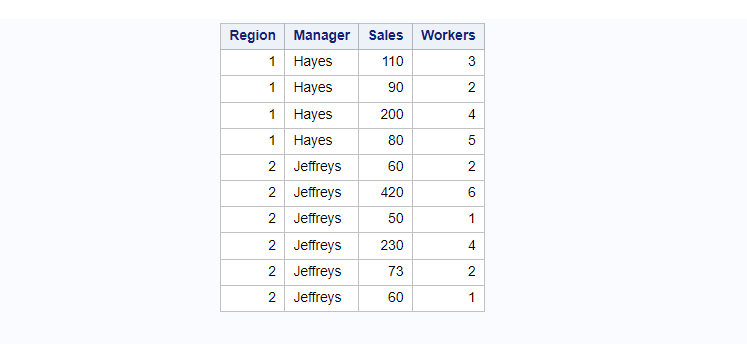
PROC REPORT With WHERE Clause
You can add filters on your SAS dataset using standard where statement and report procedure will generate output reports based on selected rows.
This example creates the report output with selected four variables described in the previous example but only on selected rows (region 2 and 3) by where clause.
				/* proc report with where clause */

proc report data=Sales_ds;
	where region in (1, 2);
	column region manager Sales Workers;
run;
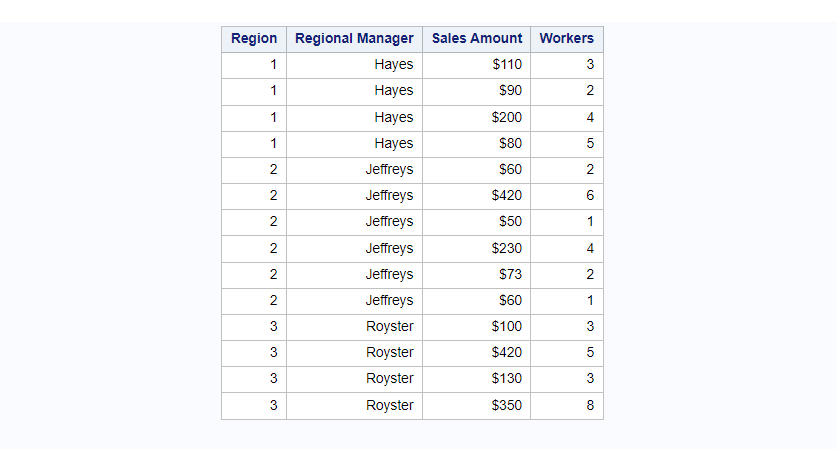
How To Customise PROC REPORT Columns
PROC REPORT procedure generates reports with default column formats. It can be changed and adjusted the way you wanted to display using the DEFINE statement with DISPLAY instructions.
You can add labels, set the alignment, and add formats to the output report. This is the extension of the last example but with some customization to the report.
Customization:
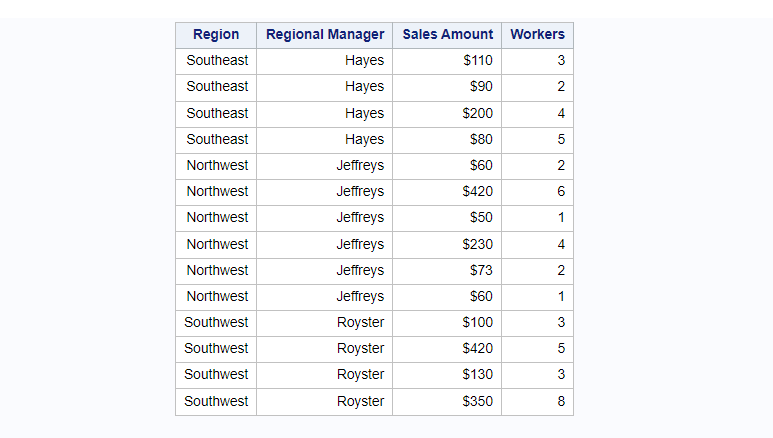
- Column “Manager” will be labelled as “Regional Manager” and aligned values to the right.
- Column “Sales” will be labelled as “Sales Amount”. Also, applied format dollar12. on column values.
				/* How To Customise Columns in a Report */

proc report data=Sales_ds;
	where region in (1, 2, 3);
	column region manager Sales Workers;
	define manager / display "Regional Manager" right;
	define Sales / display "Sales Amount" format=dollar12.;
run;
PROC REPORT With The User Defined Formats
As a part of customization for proc report output you can create special user defined formats and use it in the proc report procedure to show formatted values in the report.
We have already seen how to use SAS inbuilt formats in the previous example where format=dollar12. is applied to the “Sales” column.
This example is focused more on creating your own user defined format and using it in the proc report procedure to format column values.
If you see region values are 1, 2, 3, and so on in the input dataset. The same has been printed in the output report.
Does it represent different regions?
Yes.
What exactly are those regions?
You can’t tell looking at the report.
To add more context to this you can create a format for regions and apply them on the “region” variable to print actual region names.
Here is how you can create format:
				/* create format for region variable */

proc format;
	value regionfmt 1='Southeast'
					2='Northwest'
					3='Southwest'
					4='Northeast'
					;
run;
Now you have region format “REGIONFMT” ready to use it in the proc report procedure with the DEFINE statement followed by FORMAT=user-defined-format
We will continue with the same example but with applying this regionfmt format on “region” variable and see the output result.
				/* user defined format in proc report
procedure in sas */

proc report data=Sales_ds;
	where region in (1, 2, 3);
	column region manager Sales Workers;
	define region / display format=regionfmt.;
	define manager / display "Regional Manager" right;
	define Sales / display "Sales Amount" format=dollar12.;
run;
How To Group Data In The PROC REPORT
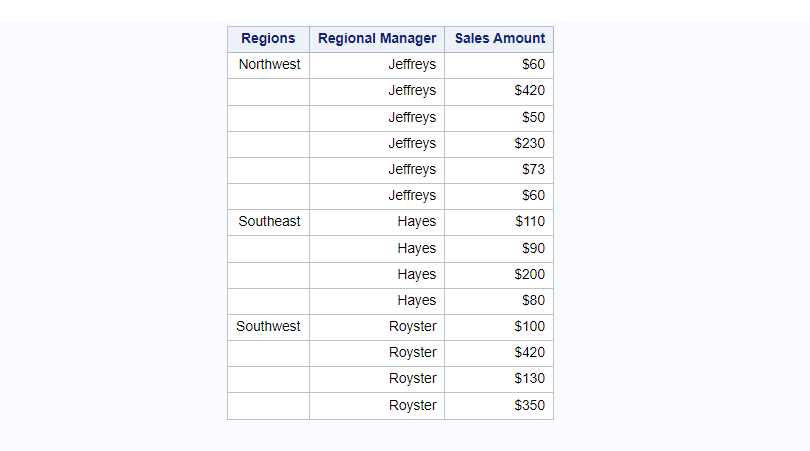
As with the DEFINE statement you can use a DISPLAY statement to format columns in a report, similarly you can use the GROUP statement with variable on which data to be grouped and displayed.
In the below example data is grouped by regions and presented with the formatted values for regions instead of original values using the format=regionfmt.
				/* How To Group Data In the PROC REPORT */

proc report data=Sales_ds;
	where region in (1, 2, 3);
	column region manager Sales;
	define region / group "Regions" format=regionfmt.;
	define manager / display "Regional Manager" right;
	define Sales / display "Sales Amount" format=dollar12.;
run;
How To Summarize Data In The PROC REPORT
In order to summarize the data and create summary statistics, you need to first define a report-item, which must be a data set variable, as an analysis variable.
And also specify what statistics you want to calculate. This example demonstrates “Sales” as an analysis variable and SUM will be calculated. Alternatively, you can also specify MIN, MAX, MEAN, or STD, etc. to calculate statistics you want to compute.
Let’s continue with the same previous example with column, group, format=, statements and explain how summation works in the proc report in SAS.
				/* How To Summarize Data In the PROC REPORT */

proc report data=Sales_ds;
	where region in (1, 2, 3);
	column region Sales;
	define region / group "Regions" format=regionfmt.;
	define Sales / analysis sum "Sum of Sales" format=dollar12.;
run;

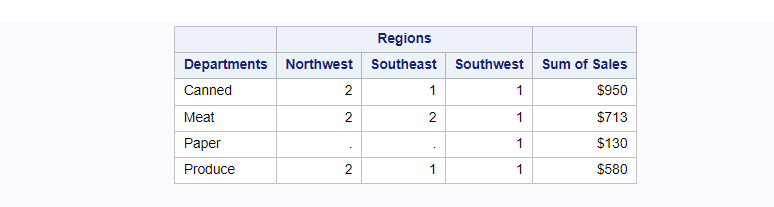
How To Transpose Report Dataset In PROC REPORT
Sometimes you may want to transpose the report dataset to make it more readable and informative.
You can do this within the proc report procedure without actually modifying or creating a separate transpose dataset using ACROSS statement.
You must define a report-item, which must be a data set variable, as an across variable. Let’s try to transpose the output displayed in the previous example by setting “region” as across variable.
				/* transpose report dataset with proc report */

proc report data=Sales_ds;
	where region in (1, 2, 3);
	column department region Sales ;
	define Sales / analysis sum "Sum of Sales" format=dollar12.;
	define department / group "Departments";
	define region / across "Regions" format=regionfmt.;
run;
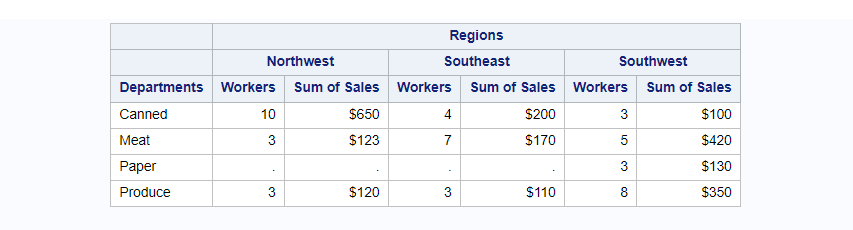
How To Create Grouped Columns In The PROC REPORT
In the continuation of the previous example, let’s try to group columns in the proc report to display the sum of sales of each department along with the number of workers working there.
The report is grouped by region and departments, calculated and displayed sum of sales and number of workers.
				/* How to create grouped columns in the PROC REPORT */

proc report data=Sales_ds;
	where region in (1, 2, 3);
	column department region, (workers Sales) ;
	define Sales / analysis sum "Sum of Sales" format=dollar12.;
	define department / group "Departments";
	define region / across "Regions" format=regionfmt.;
run;
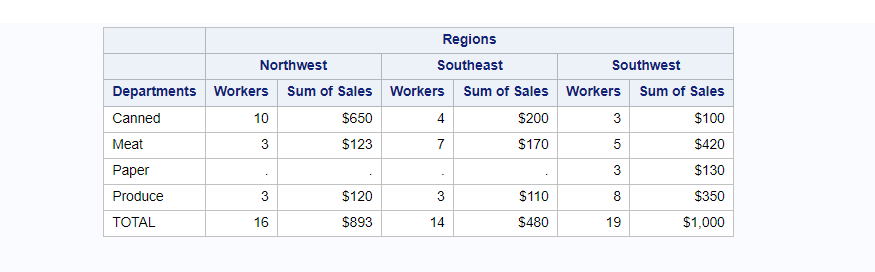
How To Add TOTAL In The PROC REPORT
Now you have calculated the sum of sales with the grouped columns by department to show sales and number of workers working in each department per region. After this you might want to add the last row with the TOTAL of each numeric column.
You’ll get the total number of workers working in each region, sum of sales for each region. Which needs to be calculated while SAS builds the report dataset. It can be done using COMPUTE BLOCK.
A compute block contains one or more programming statements that PROC REPORT executes as it builds the report. You also need to use RBREAK AFTER /SUMMERIZE – It includes a summary line as one of the break lines.
In this example naturally you would like to see total from each department hence it is wise to add the label “TOTAL” on the department variable within the compute block.
				/* How To Add TOTAL In the PROC REPORT */

proc report data=Sales_ds;
	where region in (1, 2, 3);
	column department region, (workers Sales) ;
	define Sales / analysis sum "Sum of Sales" format=dollar12.;
	define department / group "Departments" ;
	define region / across "Regions" format=regionfmt.;
	compute after;
		department="TOTAL";
	endcomp;
	rbreak after /summarize;
run;
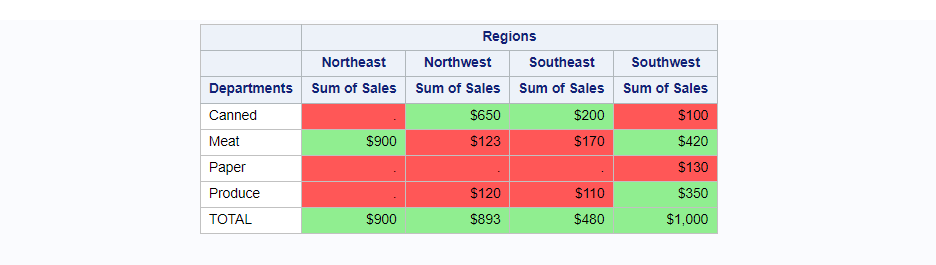
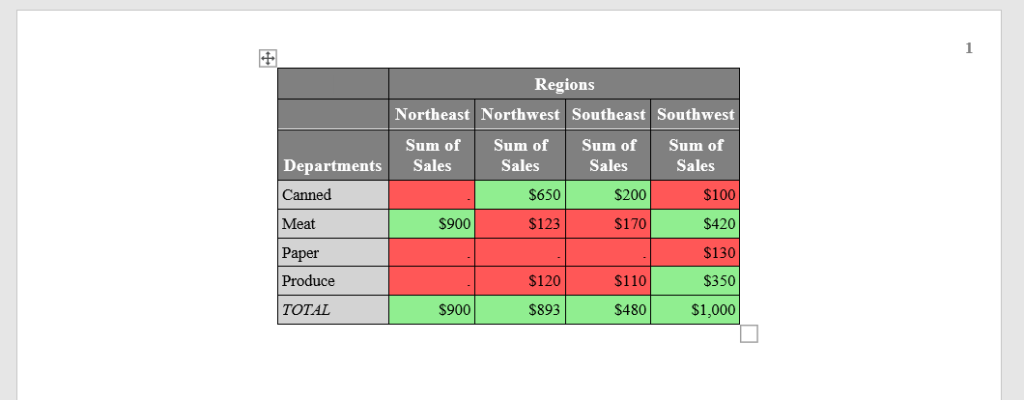
PROC REPORT With Conditional Formatting In SAS
The following simple example demonstrates how to add conditional formatting on variable “Sales” based on its value. The cells with blank Sales values or up to 199 will be highlighted with light red color and the cells with sales values more than 200 will be highlighted with light green color.
With the above information let’s first create a user defined format called “mycolorFMT”.
				/* create user defined format in sas */

proc format;
	value mycolorFMT
			  .  = 'lightred'
		Low-199  = 'lightred'
		200-High = 'lightgreen';
run;
Furthermore in the below example a compute block is used to call a DEFINE statement to format the variable “Sales” values based on the above created user defined format “mycolorFMT”. You can add even more style attributes but for now I have just added background=mycolorFMT.
				/* PROC REPORT: Conditional Formatting in SAS */

proc report data=Sales_ds;
	column department region, (Sales) ;
	define Sales / analysis sum "Sum of Sales" format=dollar12.;
	define department / group "Departments" ;
	define region / across "Regions" format=regionfmt.;
	compute after;
		department="TOTAL";
	endcomp;
	rbreak after /summarize;
	compute Sales;
		call define
		(_col_,'style',"STYLE=[BACKGROUND=mycolorFMT.]");
	endcomp;
run;
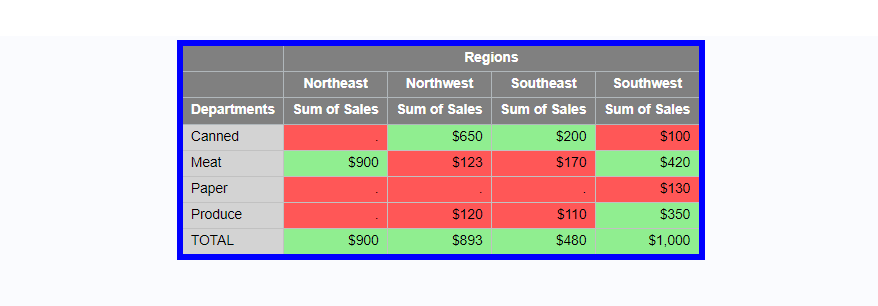
How To Style PROC REPORT In SAS With Colours
To create customized style proc report output in SAS you need to use STYLE=options.
You can use the STYLE=option to set the style element for the entire report, for all the report columns, for the column headings, for the compute block lines, for the report summaries, or on the specific report cell with conditional formatting.
- style(report): Set the style element for the report
- style(column): Set the style element for the report columns
- style(header): Set the style element for the column headings
In this example also we have used user defined regionFMT created earlier in the article.
				/* PROC REPORT: How to style a report in SAS */

proc report data=Sales_ds
	style(report)=[cellspacing=5 borderwidth=5 bordercolor=blue]
	style(column)=[background=lightgrey]
	style(header)=[background=grey color=white];

	column department region, (Sales) ;
	define Sales / analysis sum "Sum of Sales" format=dollar12.;
	define department / group "Departments" ;
	define region / across "Regions" format=regionfmt.;
	compute after;
		department="TOTAL";
	endcomp;
	rbreak after /summarize;
	compute Sales;
		call define
		(_col_,'style',"STYLE=[BACKGROUND=mycolorFMT.]");
	endcomp;
run;
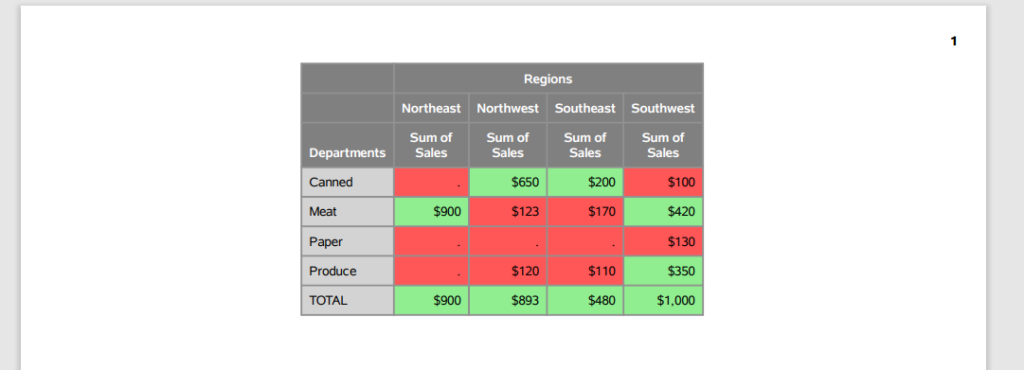
Create PDF File With PROC REPORT Output In SAS
You can print the proc report result to a PDF file in SAS. The ODS option can be used in SAS. You need to add an ODS PDF statement in the beginning of your code by specifying output file details and add an ODS PDF close statement at the end.
We will use the same earlier example to create a PDF file with proc report output using the ODS PDF statement.
				/* Print proc report result to an External PDF File */

options nodate nodetails;
ODS PDF File='/home/u61950255/Files/proc_report_Result.PDF';
proc report data=Sales_ds
	style(column)=[background=lightgrey]
	style(header)=[background=grey color=white];

	column department region, (Sales) ;
	define Sales / analysis sum "Sum of Sales" format=dollar12.;
	define department / group "Departments" ;
	define region / across "Regions" format=regionfmt.;
	compute after;
		department="TOTAL";
	endcomp;
	rbreak after /summarize;
	compute Sales;
		call define
		(_col_,'style',"STYLE=[BACKGROUND=mycolorFMT.]");
	endcomp;
run;
ODS PDF Close;
Create RTF File With PROC REPORT Output In SAS
You can print the proc report result to a RTF (Rich Text Format) file in SAS. ODS option can be used in SAS to create this document. With ODS, you can create various file types including HTML, Rich Text Format (RTF), PostScript (PS), Portable Document Format (PDF), and SAS data sets.
You need to add an ODS RTF statement in the beginning of your code by specifying output file details and add an ODS RTF close statement at the end.
We will use the earlier example and put the result into an RTF file using the ODS RTF statement.
				/* Print proc report result to an External RTF File */

options nodate nodetails;
ODS RTF File='/home/u61950255/Files/proc_report_Result.RTF';
proc report data=Sales_ds
	style(column)=[background=lightgrey]
	style(header)=[background=grey color=white];

	column department region, (Sales) ;
	define Sales / analysis sum "Sum of Sales" format=dollar12.;
	define department / group "Departments" ;
	define region / across "Regions" format=regionfmt.;
	compute after;
		department="TOTAL";
	endcomp;
	rbreak after /summarize;
	compute Sales;
		call define
		(_col_,'style',"STYLE=[BACKGROUND=mycolorFMT.]");
	endcomp;
run;
ODS RTF Close;
FAQ – PROC REPORT In SAS
PROC REPORT is a SAS procedure that generates tabular reports with more advanced features than PROC PRINT. It provides a flexible and powerful way to create custom reports that can include summary statistics, computed columns, and complex formatting.
To use PROC REPORT in SAS, you need to specify the data set to be used, the variables to be included in the report, and the summary statistics to be computed.
You can also customize the output by using various options such as the COLUMN statement, the DEFINE statement, and the COMPUTE block.
PROC REPORT provides a flexible and powerful way to create custom reports that can include summary statistics, computed columns, and complex formatting.
It also allows you to create reports that are tailored to your specific needs and can be easily updated as your data changes.
To customize the output of PROC REPORT, you can use various options such as the COLUMN statement, the DEFINE statement, and the COMPUTE block.
These options allow you to control the appearance of the output and the statistics that are displayed.