The TABULATE procedure displays descriptive statistics in tabular format, using some or all of the variables in a data set. You can create a variety of tables ranging from simple to highly customised.
The PROC FREQ, PROC MEANS, and PROC REPORT generates the statistical results but with the restricted output datasets.
PROC TABULATE produces high quality reports, and creates more informative one, two, or three dimensional presentation ready datasets. PROC TABULATE is an excellent procedure to use when it comes to computing and displaying descriptive statistics.
What Does the TABULATE Procedure Do?
PROC TABULATE computes many of the same statistics that are computed by other descriptive statistical procedures such as MEANS, FREQ, and REPORT. PROC TABULATE provides the following features:
- Creates tabular reports
- Classifies the values of variables and establish hierarchical relationships between the variables
- Mechanisms for labeling and formatting variables and procedure-generated statistics
- Creates accessible output tables when used with the ACCESSIBLETABLE system option. PROC TABULATE also provides the ability to add captions to tables.
Requirement: At least one TABLE statement is required in a PROC TABULATE procedure step.
Syntax:
				/* Basic syntax */

PROC TABULATE <options>;
	CLASS variables < / options>;
	VAR variables < / options>;
	TABLE <page> , <row> , column < / options>;
	… other statements …;
RUN;
Explanation:
- PROC TABULATE: Display descriptive statistics in tabular
- BY: Create a separate table for each BY group
- CLASS: Identify variables in the input data set as class variables
- CLASSLEV: Specify a style for class variable level value headings
- FREQ: Identify a variable in the input data set whose values represent the frequency of each observation
- KEYLABEL: Specify a label for a keyword
- KEYWORD: Specify a style for keyword headings
- TABLE: Describe the table to create
- VAR: Identify variables in the input data set as analysis variables
- WEIGHT: Identify a variable in the input data set whose values weight each observation in the statistical calculations
What Statistics PROC TABULATE Can Compute?
There are a variety of different statistics proc tabulate can compute such as descriptive statistics, quantile statistics, and hypothesis testing.
- Descriptive Statistics: COLPCTN, PCTSUM, COLPCTSUM, MAX, ROWPCTN, MEAN, ROWPCTSUM, MIN, STDDEV / STD, N, STDERR, NMISS, SUM, PAGEPCTSUM, PCTN
- Quantile Statistics: MEDIAN | P50, P1, Q3 | P75, P90, P95, P5, P10, P99, Q1 | P25, QRANGE
- Hypothesis Testing: ProbT, T
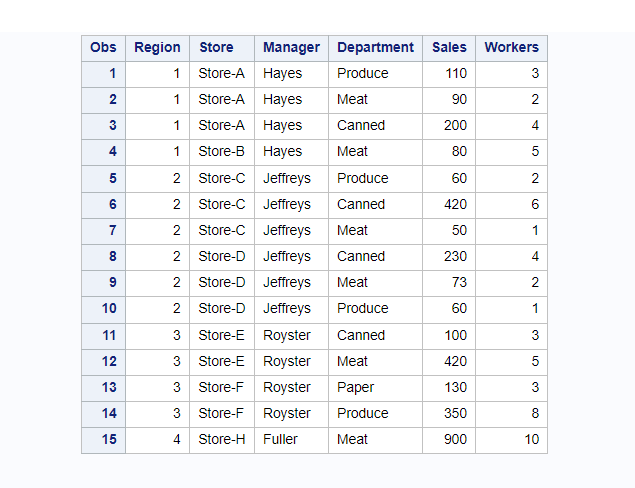
The following sample dataset will be used to demonstrate different use cases with examples of how to use proc tabulate in SAS.
				/* Create sample dataset */
data SalesReport;
	input Region Store $ Manager $ Department $ Sales 8. Workers 8.;
	datalines;
1    Store-A    Hayes       Produce    110      3
1    Store-A    Hayes       Meat       90       2
1    Store-A    Hayes       Canned     200      4
1    Store-B    Hayes       Meat       80       5
2    Store-C    Jeffreys    Produce    60       2
2    Store-C    Jeffreys    Canned     420		6
2    Store-C    Jeffreys    Meat       50		1
2    Store-D    Jeffreys    Canned     230		4
2    Store-D    Jeffreys    Meat       73		2
2    Store-D    Jeffreys    Produce    60       1
3    Store-E    Royster     Canned     100		3
3    Store-E    Royster     Meat      420      5
3    Store-F    Royster     Paper      130		3
3    Store-F    Royster     Produce    350		8
4    Store-H    Fuller      Meat      900		10
;
run;

/* view dataset */
proc print data=SalesReport;
run;
A Simple Example
Let’s start with the simplest example of using proc tabulate without adding any extra statements or options.
In the below example VAR statement is used to select the variable “Sales” on which statistics will be calculated. With the TABLE statement it describes the table to create.
				/* basic example of proc tabulate in sas */

proc tabulate data=SalesReport;
 var Sales;
 table Sales;
run;

If you observe the above result, by default TABLE statement computes SUM of the analysis variable “Sales” but you can include statistics other than SUM by modifying TABLE statement.
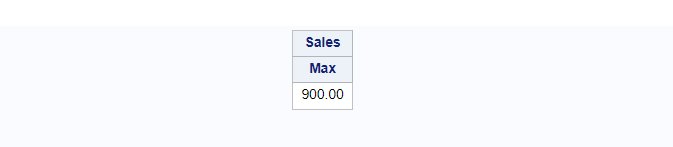
Let’s say you want to include MAX statistics on an analysis variable instead of its default SUM statistics.
It can be done by adding MAX keywords. You need to add asterisk (*) between the TABLE variable and statistics keyword, that is MAX in this case.
The below example calculates MAX statistics on analysis variable “Sales”
				/* calculate MAX using proc tabulate */

proc tabulate data=SalesReport;
 var Sales;
 table Sales*max;
run;
PROC TABULATE : Calculate Multiple Statistics (MIN, MAX, MEAN) In SAS
To calculate multiple statistics you need to slightly modify the TABLE statement.
In the previous example you’ve calculated one statistics MAX, similarly you can calculate MIN, MAX, and MEAN together by listing each statistics separately after TABLE statement.
				/* Example 1: calculate MIN, MAX, MEAN */

proc tabulate data=SalesReport;
 var Sales;
 table Sales*min Sales*max Sales*mean;
run;
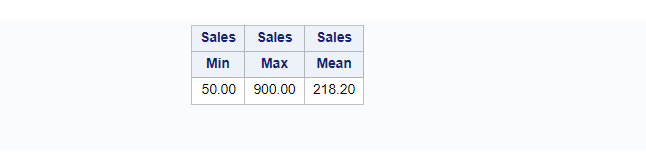
Since all these statistics are calculated on one variable you could combine all your statistical keywords and put them into a bracket instead of repeating it multiple times.
The below optimized code produces the exact same output as the previous example.
				/* Example 2: calculate MIN, MAX, MEAN */

proc tabulate data=SalesReport;
 var Sales;
 table Sales*(min max mean);
run;

PROC TABULATE With CLASS Statement
The CLASS statement specifies the variables whose values define the subgroup combinations for the analysis. You can define one more variables in the CLASS statement.
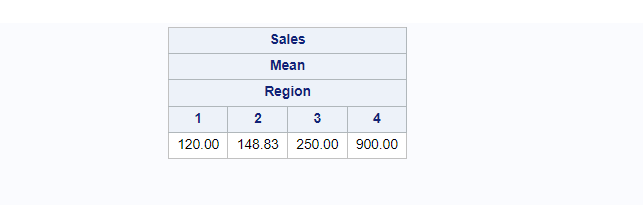
This example creates output by creating subgroup combinations to calculate average (MEAN) sales by region.
				/* proc tabulate with CLASS statement */

proc tabulate data=SalesReport;
 class region;
 var Sales;
 table Sales*mean*region; /* avergae sales by region */
run;
Formatting The PROC TABULATE Output Dataset
If you look at the input dataset, regions are specified as numeric values. It doesn’t look good in the output. You don’t know what’s region 1, region 2, and so on. You can use the PROC FORMAT procedure to format the data and create the output with meaningful information.
As you know there are 4 regions in the input dataset. Let’s assign them a meaningful name so people can understand it better.
Let’s say, region 1 is ‘Southeast’, region 2 is ‘Northwest’, region 3 is ‘Southwest’ and region 4 is ‘Northeast’.
With this information format can be created and used in the proc tabulate procedure.
				/* create format for region variable */
proc format;
	value regionfmt 1='Southeast'
					2='Northwest'
					3='Southwest'
					4='Northeast';
run;
The format must be used with a FORMAT statement followed by a variable name and its format name.
FORMAT= statement used after DATA= statement, formats the variable specified for the analysis. We have used FORMAT=dollar12. which will be applied for the analysis variable “Sales”.
The RTS=option used to specify the number of print positions to allot to all of the headings in the row dimension, including spaces that are used to print outlining characters for the row headings.
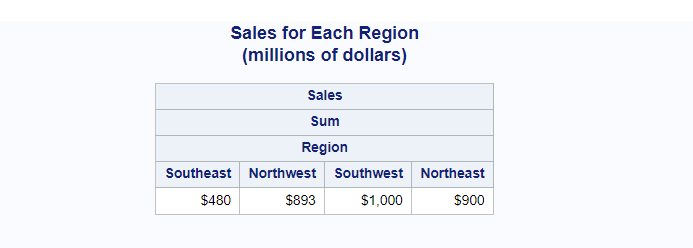
As you know by default TABLE statement calculates SUM statistics unless and until you specify anything else. In the below example we are specifying anything, it means it will calculate SUM statistics.
				/* Formatting the proc tabulate output dataset */

proc tabulate data=SalesReport format=dollar12.;
   class region ;
   var Sales;
   table Sales*region
          / rts=25;
   format region regionfmt.;
   title 'Sales for Each Region';
   title2 '(millions of dollars)';
run;
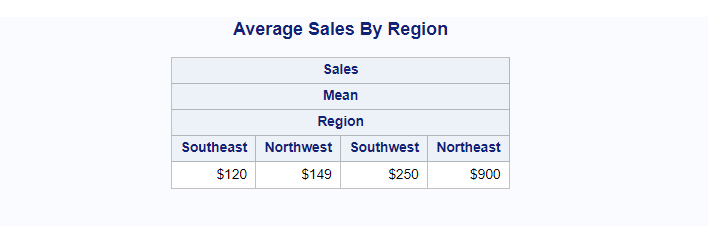
PROC TABULATE: Create Two Dimensional Statistics Output
In the earlier examples we have created some one dimensional simple statistical output through the proc tabulate procedure.
Similarly, you can create two dimensional tables with more detailed statistics with more readable structure that you want to print in the report.
The simplest example with the sample dataset we have, it could be calculating average sales by region.
				/* Create Two dimensional statistics dataset */

proc tabulate data=SalesReport format=dollar12.;
   class region;
   var Sales;
   table Sales*mean*region;
   format region regionfmt.;
   title 'Average Sales By Region';
run;
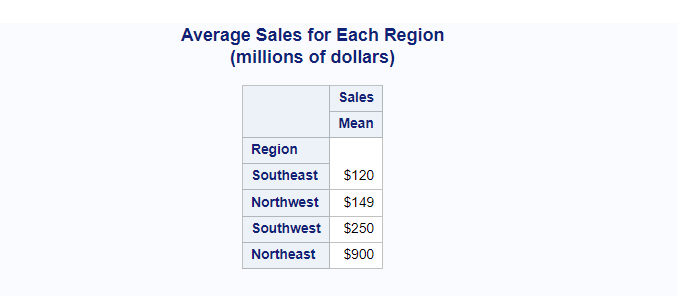
Transpose Output Data set:
You can transpose the above output to have regions listed in the rows on one column and corresponding average sales amount in the right side.
For that you need to mention two variables in the TABLE statement. The first variable goes in the left hand side and the second variable with the statistical keyword calculates values and puts them in the right hand side.
				/* transpose output dataset */

proc tabulate data=SalesReport format=dollar12.;
   class region;
   var sales;
   table region,
   		 sales*mean
          / rts=25;
   format region regionfmt.;
   title 'Average Sales for Each Region';
   title2 '(millions of dollars)';
run;
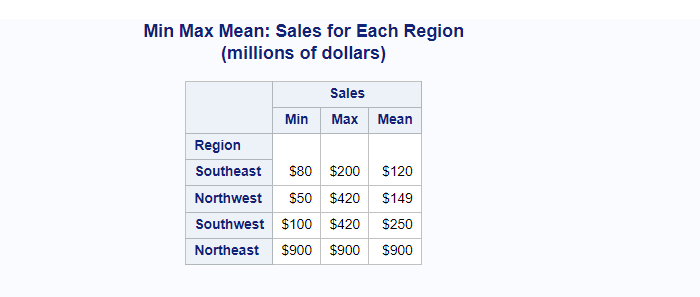
Let’s advance the same example further and add a few more statistics such as MIN, MAX, and MEAN across the regions. It can be done using TABLE statement with “Sales*(min max mean)” options.
				/* calculate min, max, mean by transposing output dataset */

proc tabulate data=SalesReport format=dollar12.;
   class region;
   var sales;
   table region,
   		 sales*(min max mean)
          / rts=25;
   format region regionfmt.;
   title 'Min Max Mean: Sales for Each Region';
   title2 '(millions of dollars)';
run;
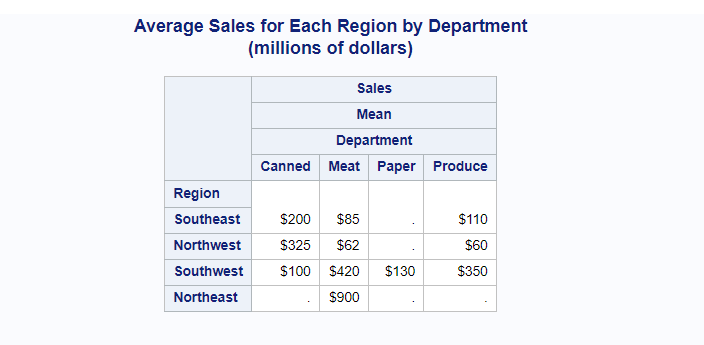
PROC TABULATE With Two Classification Variables
So far all the examples we have discussed earlier with one CLASS variable.
Let’s continue with the two-dimension output dataset but with the two CLASS variables. We are adding one more classification variable “Department” along with the variable “region”.
It means data will be classified on these two variables and sales reports will be presented as Average Sales for each region by department.
				/* two classification variables in the PROC TABULATE */

proc tabulate data=SalesReport format=dollar12.;
   class region department;
   var sales;
   table region,
   		 sales*mean*department
          / rts=25;
   format region regionfmt.;
   title 'Average Sales for Each Region by Department';
   title2 '(millions of dollars)';
run;
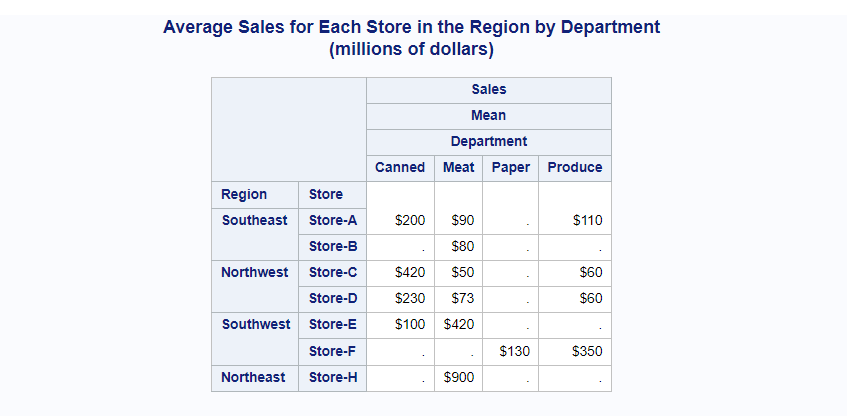
PROC TABULATE With Nested Classification Variables
You can further group the data by using nested classification variables. In the previous example, data was grouped by region. Now with the nested classification you can further add subgroups on “Store” within the region.
It also means that you need to add one more CLASS variable “Store” along with two existing variables Sales and Department.
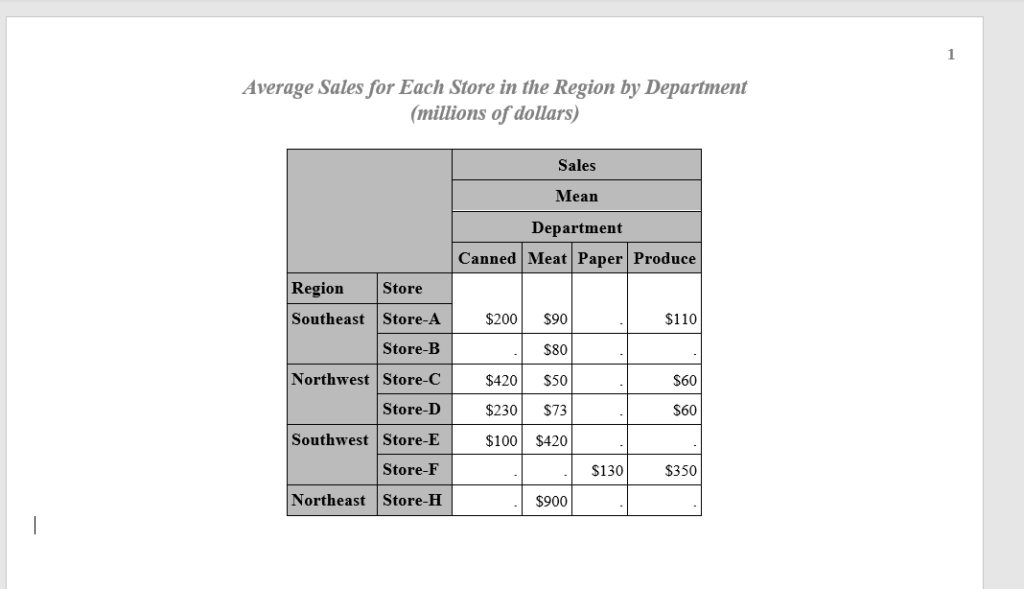
The following example calculates and presents the average sales for each store in the region by department.
				/* Nested Classification Variables in SAS */

proc tabulate data=SalesReport format=dollar12.;
   class region store department;
   var sales;
   table region*store,
   		 sales*mean*department
          / rts=25;
   format region regionfmt.;
   title 'Average Sales for Each Store in the Region by Department';
   title2 '(millions of dollars)';
run;
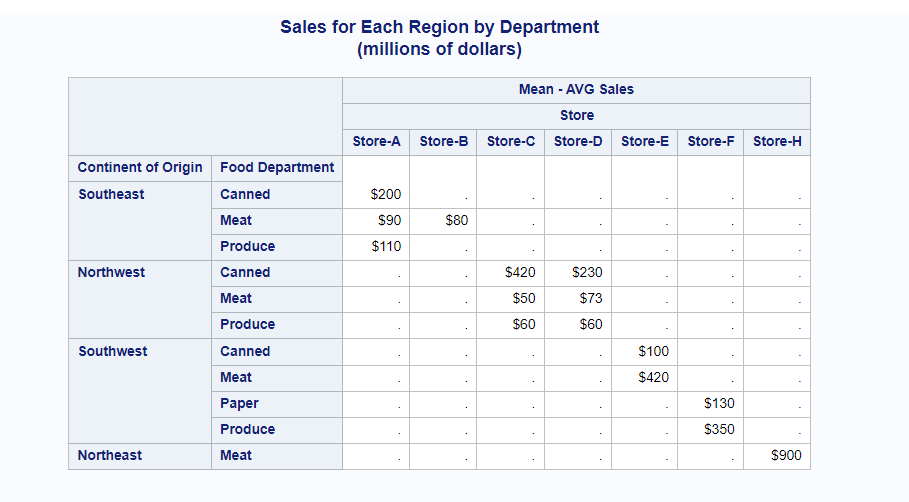
PROC TABULATE Labeling The Output Dataset
The output of the proc tabulate can be further modified and customized by adding labels to be printed in the output report.
With the minimal efforts and without writing long code to format the output result, proc tabulate gives you flexibility to add labels to the output.
Labels to the variables can be added using the LABEL keyword followed by variable name equals to “<your label text>”.
Also you can hide the default label that comes with MEAN, MAX, MIN statistics.
In this example we are calculating average by using MEAN but the “MEAN” cell can be eliminated from the output by using keylabel keyword followed by mentioning mean=” “
				/* Labeling the proc tabulate output dataset in SAS */

proc tabulate data=SalesReport format=dollar12.;
   class region store department;
   var sales;
   table region*department,
   		 sales*mean*store
          / rts=25;
   format region regionfmt.;
   label region = "Continent of Origin"
         Sales = "Mean - AVG Sales"
         department = "Food Department"
                 ;
   keylabel mean = " ";
   title 'Sales for Each Region by Department';
   title2 '(millions of dollars)';
run;
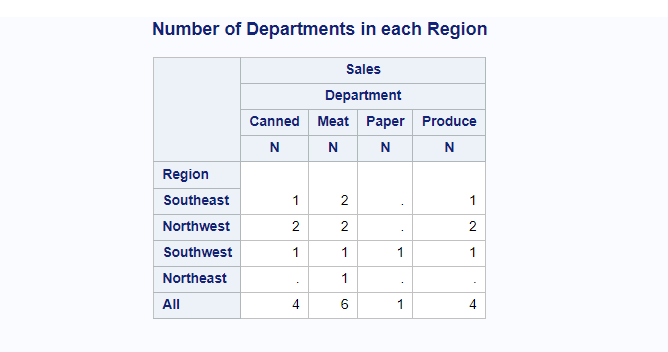
PROC TABULATE: Calculating TOTAL Across The Rows and Columns
You must have calculated totals across the rows and columns in the excel but to do the same using sas code, you need to write a long code.
But it can be make it simple and possible with small code using the proc tabulate procedure. You just need to use “ALL” statement after TABLE variable statements.
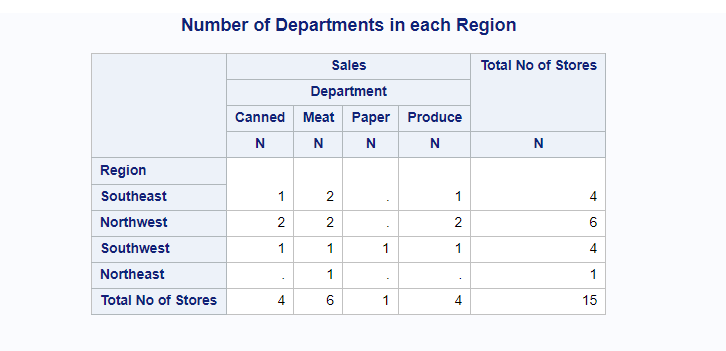
Here we are calculating the number of departments in each region. Addition will be done on column level and row will be flagged as “All”.
				/* Example 1: Calculate column level Total  */

proc tabulate data=SalesReport;
   class region department;
   var sales;
   table region ALL,
   		 sales*department*N;
   format region regionfmt.;
  title 'Number of Departments in each Region';
run;
What if you want to calculate row level total also?
It’s absolutely possible to calculate SUM statistics for each row. Let’s change the default “All” name with something like “Total No of Stores” in the output using ALL=”<customised label>”
				/* Example 2: Calculate total across the the rows and columns */

proc tabulate data=SalesReport;
   class region department;
   var sales;
   table region ALL='Total No of Stores',
   		 sales*department*N ALL='Total No of Stores';
   format region regionfmt.;
   title 'Number of Departments in each Region';
run;
PROC TABULATE: Three Dimensional Output Dataset
PROC TABULATE procedure doesn’t create the traditional three dimensional output dataset. But it creates multiple two-dimensional output datasets.
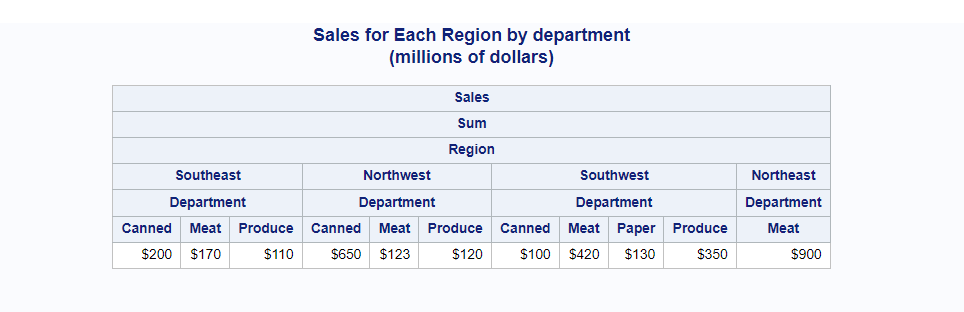
Before we jump into creating multiple output datasets, let’s start with the basic example where we create a report with sales for each region by department.
				/* three dimensional proc tabulate output dataset */

proc tabulate data=SalesReport format=dollar12.;
   class region Department;
   var Sales;
   table Sales*region*Department
          / rts=25;
   format region regionfmt.;
   title 'Sales for Each Region by department';
   title2 '(millions of dollars)';
run;
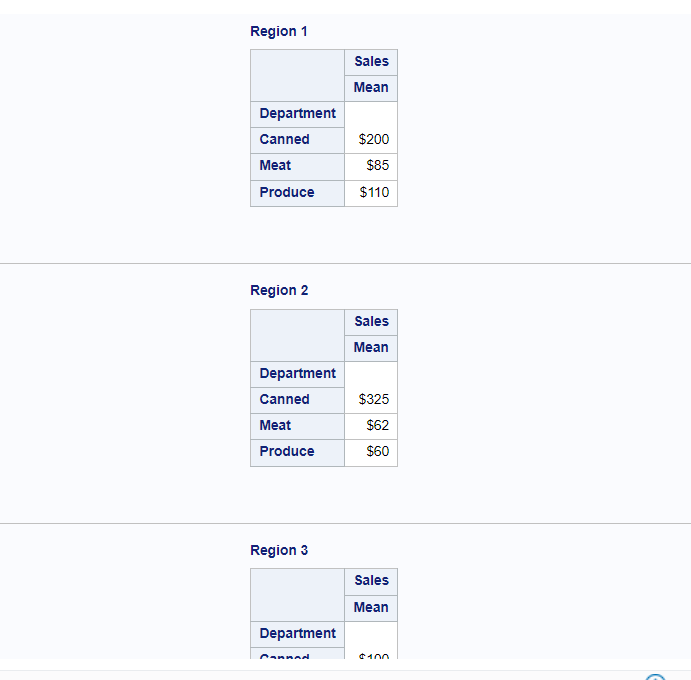
Now you can split the above two-dimensional output with multiple output dataset separated by the region. It means separate output datasets will be created for each region that prints sales by department.
				/* Group and split the output dataset */

proc tabulate data =SalesReport format=dollar12.;
 class Department region;
 var Sales;
 table region,Department,Sales*mean;
run;
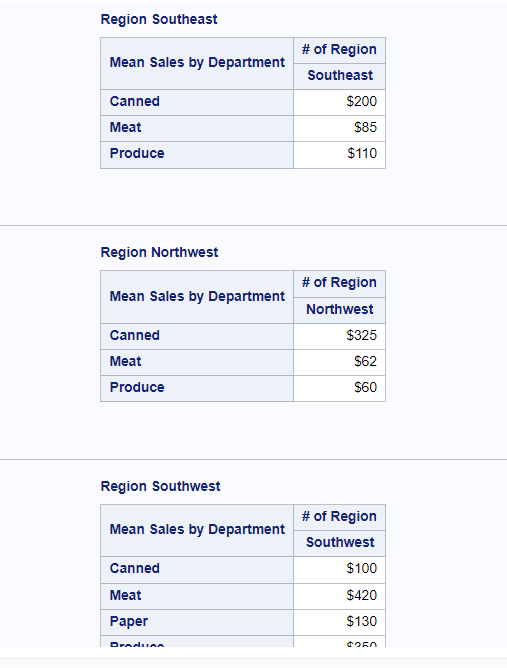
Above output dataset looks great but you even further format the datasets by adding formats and labeling the output variables.
The following code creates the multiple two-dimensional output datasets with the customized labels.
				/* proc tabulate with separate grouped output dataset */

proc tabulate data = SalesReport format=dollar12.;
 class Department region ;
 var Sales;
 table region,
 		Department='',
 		Sales=''*region='# of Region'*mean=''*F=dollar8.
 		/box="Mean Sales by Department";
 format region regionfmt.;
run;
Create RTF File With PROC TABULATE Output In SAS
You can print the proc tabulate result to a RTF (Rich Text Format) file in SAS.
The ODS option can be used in SAS to create this document. ODS statements help generate high-quality, detailed presentation output from SAS. With ODS, you can create various file types including HTML, Rich Text Format (RTF), PostScript (PS), Portable Document Format (PDF), and SAS data sets.
You need to add an ODS RTF statement in the beginning of your code by specifying output file details and add an ODS RTF close statement at the end.
We will use the earlier example and put the result into an RTF file using the ODS RTF statement.
				/* Print proc tabulate result to an External RTF File */

options nodate nodetails;
ODS RTF File='/home/u61950255/Files/proc_tabulate_Result.RTF';
proc tabulate data=SalesReport format=dollar12.;
   class region store department;
   var sales;
   table region*store,
   		 sales*mean*department
          / rts=25;
   format region regionfmt.;
   title 'Average Sales for Each Store in the Region by Department';
   title2 '(millions of dollars)';
run;
ODS RTF Close;
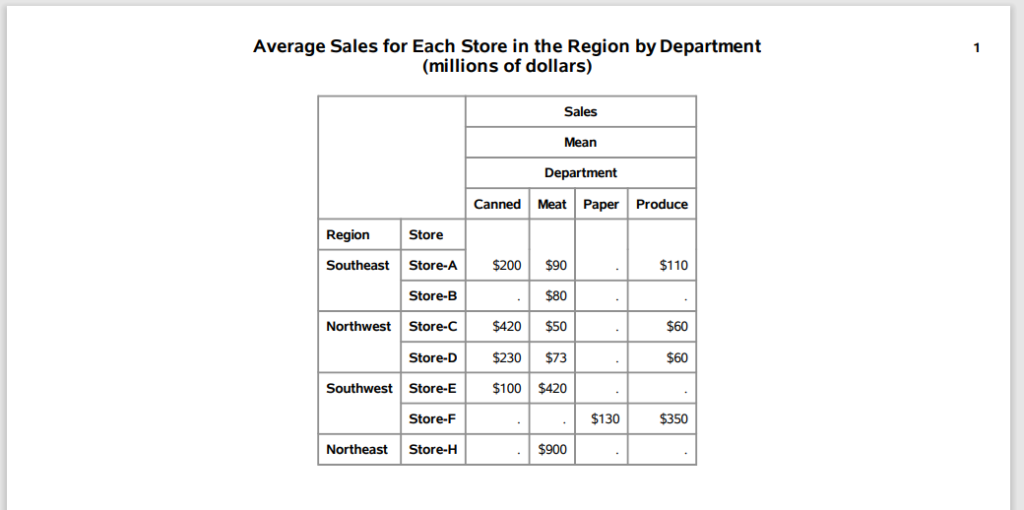
Create PDF File With PROC TABULATE Output In SAS
You can print the proc tabulate result to a PDF file in SAS similar to an RTF file. The ODS option can be used in SAS.
You need to add an ODS PDF statement in the beginning of your code by specifying output file details and add an ODS PDF close statement at the end.
We will use the earlier example which we are using to create an RTF file to create PDF file output using the ODS PDF statement.
				/* Print proc tabulate result to an External PDF File */

options nodate nodetails;
ODS PDF File='/home/u61950255/Files/proc_tabulate_Result.PDF';
proc tabulate data=SalesReport format=dollar12.;
   class region store department;
   var sales;
   table region*store,
   		 sales*mean*department
          / rts=25;
   format region regionfmt.;
   title 'Average Sales for Each Store in the Region by Department';
   title2 '(millions of dollars)';
run;
ODS PDF Close;
FAQ – PROC TABULATE In SAS
PROC TABULATE is a SAS procedure that displays descriptive statistics in tabular format using some or all of the variables in a data set.
PROC TABULATE provides simple but powerful methods to create tabular reports, flexibility in classifying the values of variables and establishing hierarchical relationships between the variables, and mechanisms for labeling and formatting variables and procedure-generated statistics.
To create a simple table using PROC TABULATE, you need to specify the variables to be used in the table, the summary statistics to be computed, and the format of the output.
To customize the output of PROC TABULATE, you can use various options such as the FORMAT statement, the CLASS statement, the VAR statement, and the TABLE statement. These options allow you to control the appearance of the output and the statistics that are displayed.